IMAGE

Fig. 1

ID
ZDB-IMAGE-250422-90
Source
Figures for Iegiani et al., 2025
Image
Figure Caption

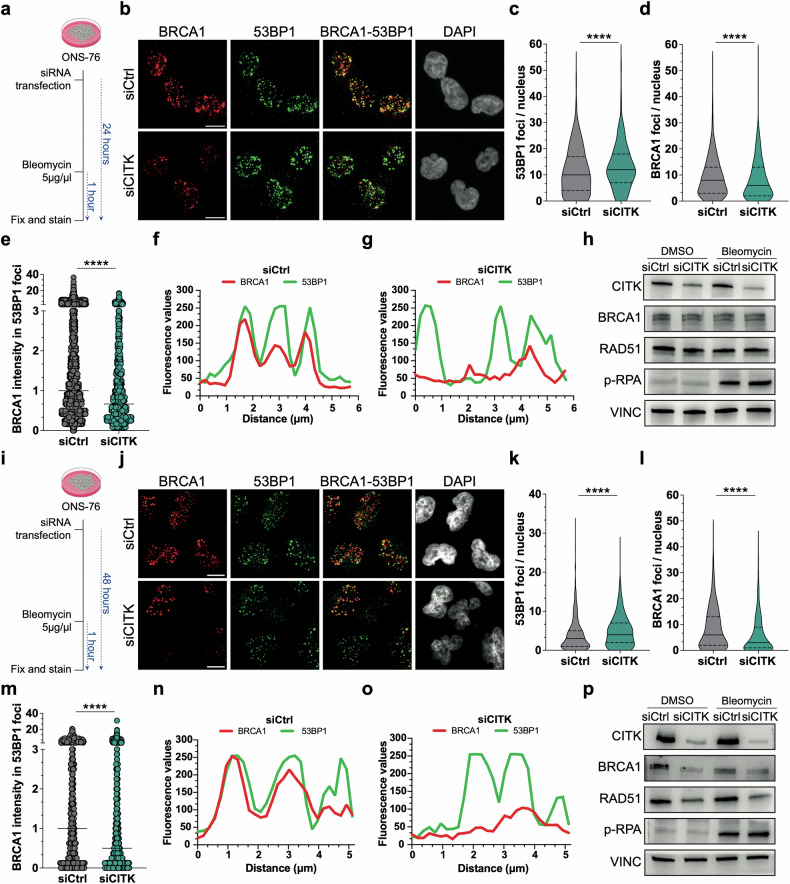
Fig. 1 CITK knockdown reduces BRCA1 levels and colocalization between BRCA1 and 53BP1 after induction of DNA damage.

a, i Schematic representation of the experiments performed. b, j Representative confocal images of ONS-76 cells treated as highlighted in (a,i), respectively, immunostained for BRCA1 and 53BP1 and counterstained with DAPI. Scale bars: 10 μm. c, d, k, l Quantification of 53BP1 and BRCA1 foci per nucleus, in cells treated as in (b, j), respectively. e, m Quantification of BRCA1 signal intensity in each 53BP1 focus, in cells treated as in (b, j), respectively, after normalization to the median of control samples. f, g, n, o Examples of co-localization profiles between BRCA1 and 53BP1 signals in ONS-76 cells treated as (b, j), respectively. Fluorescence intensity was plotted for the two channels along a 6-μm-long line, randomly drawn in the nuclei of exemplar cells. h, p Western blot analysis of total lysate from ONS-76, obtained at the end of experiments performed as highlighted in (a, i), respectively. The levels of CITK, BRCA1, RAD51, phosphor-RPA were analyzed, and the internal loading control was Vinculin (VINC). All quantifications were based on at least four independent biological replicates; >300 cells were analyzed per condition in each replicate. ****P < 0.0001; Mann– Whitney U test.

Acknowledgments
This image is the copyrighted work of the attributed author or publisher, and ZFIN has permission only to display this image to its users. Additional permissions should be obtained from the applicable author or publisher of the image. Full text @ Cell Death Dis.