
- Title
-
Genetic inactivation of FAAP100 causes Fanconi anemia due to disruption of the monoubiquitin ligase core complex
- Authors
- Kuehl, J., Xue, Y., Yuan, F., Ramanagoudr-Bhojappa, R., Pickel, S., Kalb, R., Chandrasekharappa, S.C., Wang, W., Zhang, Y., Schindler, D.
- Source
- Full text @ Journal of Clin. Invest.
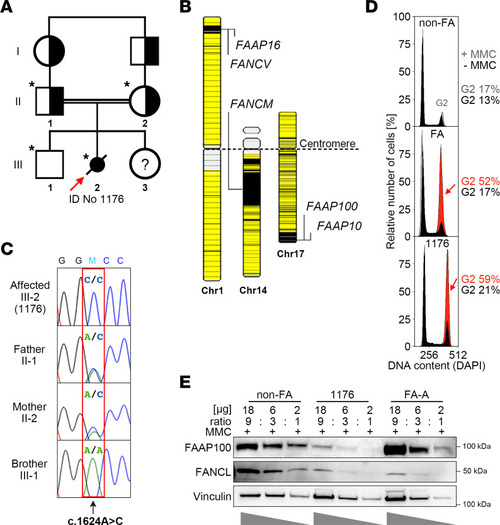
Origin, location, segregation, and implications of the ( |
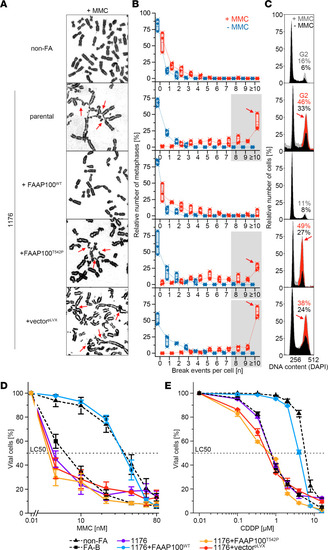
Ectopic expression of FAAP100WT or FAAP100T542P in FAAP100-deficient cells. ( |
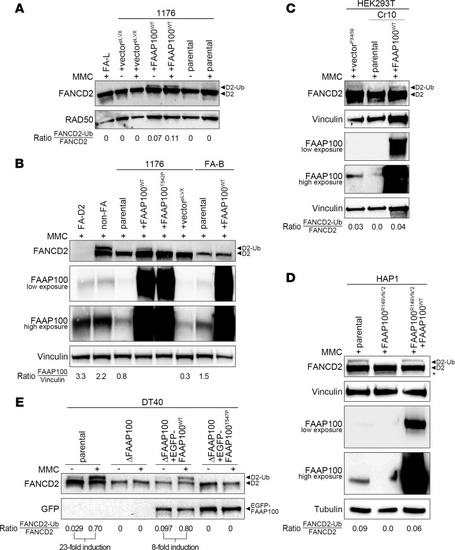
FANCD2 monoubiquitylation capacity of FAAP100-inactivated human and avian cell lines. ( |
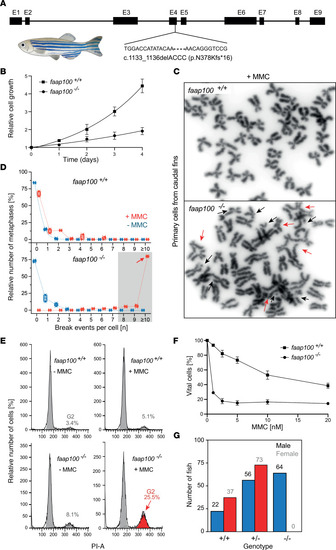
Cellular FA phenotype of ( PHENOTYPE:
|
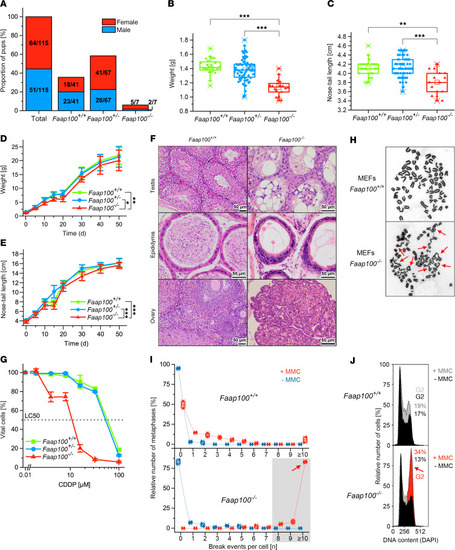
Characteristics of the ( |
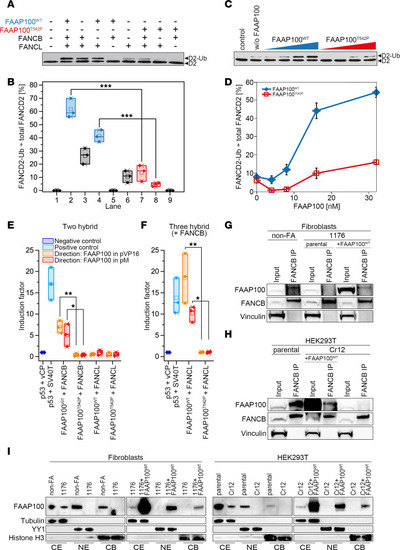
Ligase activity, interaction, and subcellular localization studies with FAAP100T542P. ( |