|
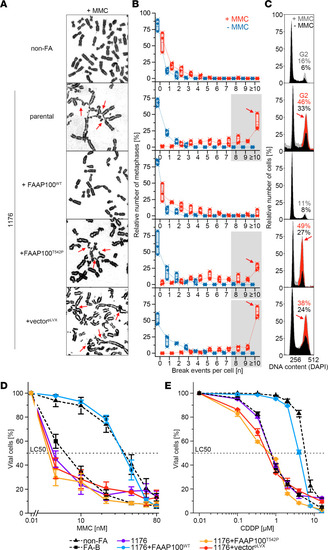
Ectopic expression of FAAP100WT or FAAP100T542P in FAAP100-deficient cells. (A) Metaphase micrographs of FAAP100T542P-mutant 1176 cells after exposure of the cultures to MMC (100 ng/mL, 48 hours). Parental 1176 cells and mock- or mutation-transduced (+vectorpLVX or +FAAP100T542P) 1176 cells show distinctly increased chromosome breakage, mostly of the chromatid type, whereas WT transduced 1176+FAAP100WT cells are rescued. Radials are marked with red arrows. (B) Box plots reflect the proportion of cells with the indicated number of chromosome breaks per metaphase; single value (♦), median (─), mean (□), IQR (─), minimum (×), and maximum (×) for the number of breaks from 3 independent experiments; blue symbols are from untreated cultures, and red are from cultures exposed to MMC (100 ng/mL, 48 hours). Light gray shading indicates high rates of 8 or more breaks per metaphase, and red arrows highlight pivotal rates of 10 or higher. Cell lines are the same as in A. Fifty metaphases were analyzed per experiment. (C) Cell-cycle analysis by flow cytometry. Exemplary individual measurements. Black histograms are from untreated cultures, and superimposed gray or gray/red are from cultures exposed to MMC (10 ng/mL, 48 hours). The percentage of cells in the G2 phase is indicated. Red coloring and arrows denote an increased G2 compartment size. Variability and significance of G2 phase arrest in repeated measurements are shown in Supplemental Figure 4A. Cell lines are the same as in A. (D and E) Dose-response (survival) curves of parental and mock FAAP100WT or FAAP100T542P transduced 1176 cells from cultures exposed to different concentrations of MMC (D) or CDDP (E) for 8 days. Data indicate the mean ± SD of 3 independent experiments. Cell lines are the same as in A and are identical in D and E. FA-B and non-FA are FA and normal control, respectively. LC50, 50% lethal concentration. Note that the transduction of FAAP100WT complements the repair defect in all assays, whereas FAAP100T542P does not.
|