|
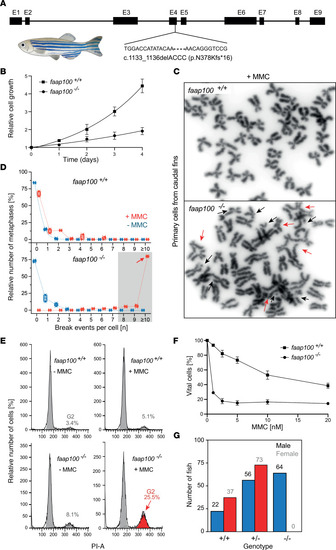
Cellular FA phenotype of faap100-KO zebrafish. (A) Schematic of the CRISPR/Cas9-mediated faap100 gene–KO (si:dkey-57h18.1). (B) Growth curves show slower proliferation of primary cell cultures from faap100–/– fish (circles) than from faap100+/+ fish (squares). The mean ± SD for multiples of the initial cell number of 3 independent subcultures is shown for each time point, with day 0 counts set to 1. ***P < 0.001 (t test) at day 4. Data were exponentially fitted. (C) Metaphase micrographs after exposure of faap100+/+ or faap100–/– cell cultures to MMC (2.5 ng/mL, 24 hours). faap100–/– cells showed markedly increased chromosome breakage, mostly of the chromatid type. Red arrows indicate radials and black arrows other types of breakage. Original magnification, ×1,000. (D) Box plots reflect the proportion of faap100+/+ (top) or faap100–/– (bottom) cells with the indicated number of chromosome breaks per metaphase. Single value (♦), median (─), mean (□), IQR (─), minimum (x), and maximum (x) for the number of breaks from 2 independent experiments; blue symbols represent data from untreated cultures, and red symbols represent data from cultures exposed to MMC (2.5 ng/mL, 24 hours). Light gray shading indicates high rates of 8 or more breaks per metaphase, and the red arrow highlights a pivotal rate of 10 or higher. A total of 31–53 metaphases were analyzed per experiment. (E) Flow cytometric cell-cycle analysis of faap100+/+ (top) and faap100–/– (bottom) cell cultures without MMC (– MMC) or after exposure to MMC (+ MMC) (5 ng/mL, 48 hours). Exemplary individual measurements are shown. The percentages of cells in G2 are shown. Red coloring and arrow indicate an increased G2 compartment size. (F) Dose-response (survival) curves of faap100+/+ (top) and faap100–/– (bottom) cells from cultures exposed to different concentrations of MMC. The mean ± SD of triplicates is shown. (G) Homozygous KO of faap100 resulted in complete sex reversal from female to male. The numbers above the bars represent the number of fish in each sex and genotype category.
|