|
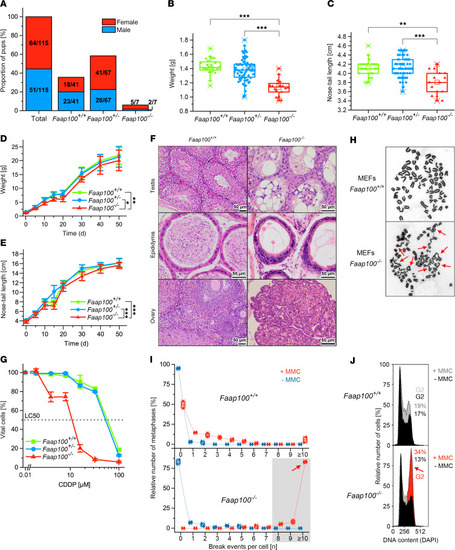
Characteristics of the Faap100–/– mouse. (A) Proportions and numbers of female (red) and male (blue) Faap100+/+, Faap100+/–, and Faap100–/– mouse offspring from heterozygous mating. (B) Faap100–/– mice show significantly lower birth weight. Box-and-whisker plots: single value (■, ●, ▲), median (─), mean (□), IQR (─), whiskers (–), and range (x). n = 24 (Faap100+/+), n = 73 (Faap100+/–), and n = 18 (Faap100–/–). ***P < 0.001, by 1-way, repeated-measures ANOVA with Tukey’s test (B and C). (C) Shortened nose-to-tail length in Faap100–/– neonatal mice. n = 23 (Faap100+/+) , n = 68 (Faap100+/–), and n = 15 (Faap100–/–). **P 0.01 and ***P < 0.001. (D) Reduced postnatal weight gain in Faap100–/– mice. n = 9–30 (Faap100+/+), n = 10–83 (Faap100+/–), and n = 6–11 (Faap100–/–). *P < 0.05 and **P < 0.01, by 2-way, repeated-measures ANOVA with post hoc Tukey’s test (D and E). (E) Slower growth in body length of Faap100–/– mice. n = 9 (Faap100+/+), n = 11–42 (Faap100+/–), and n = 9 (Faap100–/–). ***P < 0.001. (F) Gonads in Faap100–/– mice appear dysplastic, unlike normal gonads in Faap100+/+ mice. Scale bars: 50 μm. (G) Dose-response survival curves of MEFs exposed to CDDP (8 days) show reduced survival of Faap100–/– cells. Data are the mean ± SD of triplicates. LC50, 50% lethal concentration. (H) Metaphase micrographs after MMC exposure (100 ng/mL, 48 hours) show increased radials (red arrows) and chromatid breaks in Faap100–/– MEFs. Original micrographs have been magnified approximately ×1,000. (I) Box plots of breaks per metaphase from 2 independent experiments. Red symbols: MMC-treated; blue: untreated. Gray zone = 8 or more breaks; red arrow = 10 or more breaks. n = 50 metaphases/experiment. (J) Cell-cycle analysis reveals G2-phase arrest in Faap100–/– MEFs after MMC exposure (10 ng/mL, 48 hours). Exemplary individual measurements. Black histograms: untreated; gray or gray/red overlaid histograms: MMC-treated. The percentage of G2 cells is indicated. Red coloring and arrow: increased G2 compartment size. Variability and significance of G2-phase arrest in repeated measurements are shown in Supplemental Figure 4D.
|