FIGURE SUMMARY
Title

Modeling ANKRD26 5'-UTR mutation-related thrombocytopenia in zebrafish

Authors
Zheng, L., Wu, Z., Yada, N., Liu, S., Lin, C., Bignotti, A., Zhao, X., Zheng, X.L.
Source
Full text @ Dis. Model. Mech.

Generation and characterization of ankrd26ku6 zebrafish. (A) Schematic representation of human, mouse and zebrafish Ankrd26 protein, comprising N-terminal ankyrin (ANK) modules and C-terminal coiled-coil domain. (B) Schematic representation of the genomic DNA structure of ankrd26 and its encoded mRNA, showing the targeted area in the 5′-untranslated region (5′-UTR) of ankrd26 by CRISPR/Cas9 and the two deleted nucleotides (nt) in the 5′-UTR (Δ2). ORF, open reading frame. (C) Sanger sequencing confirmed the deletion of a two-nucleotide (GC) sequence (boxed). This mutant allele was named as ku6 in ZFIN. (D) Relative ankrd26 mRNA levels in pooled wild-type (wt), ankrd26ku6/+ (heterozygote) and ankrd26ku6 (homozygote) zebrafish larvae (n=10) at 5 days post-fertilization (dpf). (E,F) Western blotting (E) and densitometric analysis (F) of Ankrd26 protein expression levels in wt, ankrd26ku6/+ and ankrd26ku6 zebrafish larvae. β-Actin protein was used as protein loading control in E. Data are means±s.e.m. of at least three independent experiments. Mann–Whitney U-test was used to analyze differences between two groups. *P<0.05, **P<0.01 and ***P<0.005.

Morphology of zebrafish larvae and immunohistochemical detection of Ankrd26 protein in adult zebrafish tissues. (A-D) Representative morphology of a 4 dpf larva, including a light microscopic image, a red fluorescent (gata-1/DsRed) image, a green fluorescent (fli-1/eGFP) image and a merged image as indicated. (E-H) Immunohistochemical staining of Ankrd26 protein in hepatocytes in the liver (E,E′), proximal or distal tubules in the kidney (F,F′), ellipsoids in the spleen (G,G′) and epithelial cells in the intestinal villi (H,H′). Red arrowheads indicate representative Ankrd26-postivie cells. (I-L) Negative controls for immunohistochemical staining in the liver (I), kidney (J), spleen (K) and intestine (L), without incubation with primary antibody against zebrafish Ankrd26.

Thrombocyte counts and their adhesion/aggregation on a collagen surface under flow. (A-C) Total (A), young (B) and mature (C) thrombocyte counts in wt (n=12), ankrd26ku6/+ (n=15) and ankrd26ku6 (n=12) zebrafish. The data shown represent the individual values, mean and s.e.m. Kruskal–Wallis analysis was used to determine statistical significance. (D) The surface coverage of fluorescent thrombocytes on a fibrillar collagen-coated surface in the microfluidic channel after perfusion of pooled whole blood obtained from wt (top) and ankrd26ku6 (bottom) zebrafish under arterial shear (15 dyne/cm2). (E) The rate of fluorescence accumulation (or thrombocyte adhesion) on a fibrillar collagen-coated surface following perfusion of pooled whole blood from wt and ankrd26ku6 zebrafish. Data are presented as the mean±s.e.m. from three independent experiments. ns, P>0.05; *P<0.05 and ***P<0.005.

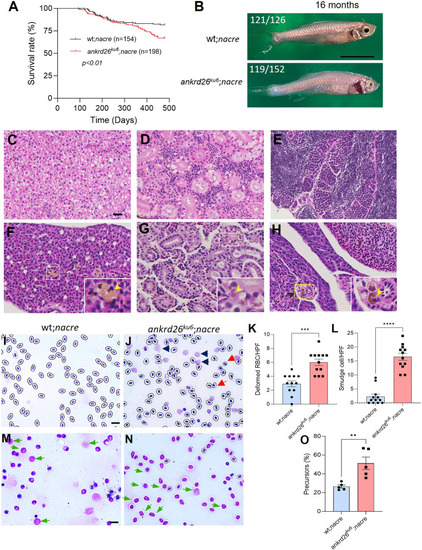
Survival and histological analyses of tissues, blood and kidney marrow of zebrafish of various genotypes. (A) Kaplan–Meier survival analysis indicates the survival rates of wt;nacre (n=154) and ankrd26ku6;nacre (n=198) zebrafish over a 16-month observation. (B) Representative gross morphology in wt;nacre and ankrd26ku6;nacre zebrafish at the age of 16 months. The proportions of abnormal body shapes are indicated at the top left in images. (C-H) Hematoxylin and Eosin staining indicates the absence (C-E) and presence (F-H) of lipofuscin deposition in wt;nacre and ankrd26ku6;nacre zebrafish, respectively, at the age of 16 months, in the liver (C,F), kidney (D,G) and spleen (E,H). Yellow arrowheads indicate representative lipofuscin deposition in the organ tissues of ankrd26ku6;nacre zebrafish. (I,J) Giemsa staining of peripheral blood smears from wt;nacre (I) and ankrd26ku6;nacre (J) zebrafish. Red and black arrowheads in J indicate deformed red blood cells and smudge cells, respectively. (K,L) Quantitation of the deformed red blood cells (K) and smudge cells (L) in peripheral blood smears of wt;nacre and ankrd26ku6;nacre zebrafish. HPF, high-power field; RBC, red blood cells. (M,N) Representative images of stained kidney marrow cells in wt;nacre (M) and ankrd26ku6;nacre (N) zebrafish. Green arrows indicate the increased number of myeloid progenitor cells in ankrd26ku6 zebrafish. (O) Quantitation of myeloid progenitor cells in kidney marrow smears from wt;nacre and ankrd26ku6;nacre zebrafish at the age of 16 months. Data in K, L and O are individuals, means (bars) and s.e.m. (horizontal lines). Mann–Whitney U-test was performed to determine the statistical significance of differences between the two groups. **P<0.01, ***P<0.005, and ****P<0.0001. Scale bars: 10 µm (C,I,M); 1 cm (B).

Differential proteomics in young thrombocytes of wt and ankrd26ku6 zebrafish. (A) Endogenous fluorescence labeling to differentiate erythrocytes (only in red), young thrombocytes (in both red and green as indicated by white arrowheads) and mature thrombocytes (only in green as indicated by blue arrows). (B) Flow cytometric gating for erythrocytes (Q1-3) and thrombocytes (Q2-3). (C) Purity of fluorescence-activated cell sorting-isolated young (Q2-2) and mature (Q4-2) thrombocytes. (D) Heat map showing the relative abundance of 35 ranked proteins identified in young thrombocytes of wt and ankrd26ku6 zebrafish. Ranking is based on fold change >1.25 (n=3). (E) Volcano plot demonstrating the fold change of 2425 proteins identified in young thrombocytes of wt and ankrd26ku6 zebrafish (n=3). Red dots represent 35 differentially expressed proteins with fold change >1.25 (P<0.05). (F) Quantification of ninjurin 1 mRNA levels in zebrafish larvae of different genotypes. (G) Molecular function of proteins with significant change in their expression in young thrombocytes of ankrd26ku6 zebrafish compared with those of wt controls.

Differential proteomics in mature thrombocytes from wt and ankrd26ku6 zebrafish. (A) Heat map showing the 71 differentially expressed proteins identified in the mature thrombocytes from wt and ankrd26ku6 zebrafish. Ranking is based on fold change >1.25 (n=3). (B) Volcano plot demonstrating the fold change of 2425 proteins in mature thrombocytes from ankrd26ku6 zebrafish (n=3) compared with those from wt controls (n=3). Each sample represents pooled blood from ten individual zebrafish. Red dots represent 71 differentially expressed proteins with significant fold change >1.25 (P<0.05). (C-E) Molecular functions (C), classes (D) and cellular processes (E) of proteins with significantly changed expression in mature thrombocytes of ankrd26ku6 zebrafish compared with those of wt controls.

ANKRD26 is a potential modifier of the thrombotic thrombocytopenic purpura phenotype. (A-C) Total (A), young (B) and mature (C) thrombocyte counts in zebrafish (6-8 months old) of different genotypes as indicated. Data are presented as individual values, mean (bars) and s.e.m. (horizontal lines). Kruskal–Wallis analysis was performed to determine statistical significance. (D,E) Flow cytometric analysis showing the percentage of ANKRD26-positive (Q1+Q2) cells in the peripheral blood buffy coat from unaffected controls (Ctrl.; D) and patients with immune thrombotic thrombocytopenic purpura (iTTP; E). (F) Quantification of ANKRD26-positive cells in the controls (n=4) and patients with iTTP (n=4). (G) Confocal fluorescent imaging showing the expression of ANKRD26 (green) and glycoprotein 1bα protein (CD41a; red) in megakaryocytes from peripheral blood smears of patients with iTTP. The nucleus was stained with DAPI (blue). (H) Western blot analysis demonstrating the levels of ANKRD26 protein in platelet lysates of controls and patients with iTTP. (I) Quantitation of plasma levels of soluble ANKRD26 protein in unaffected controls (n=11) and patients with iTTP (n=25). *P<0.05, **P<0.01, ***P<0.005, and ****P<0.0001.

Acknowledgments
This image is the copyrighted work of the attributed author or publisher, and ZFIN has permission only to display this image to its users. Additional permissions should be obtained from the applicable author or publisher of the image. Full text @ Dis. Model. Mech.