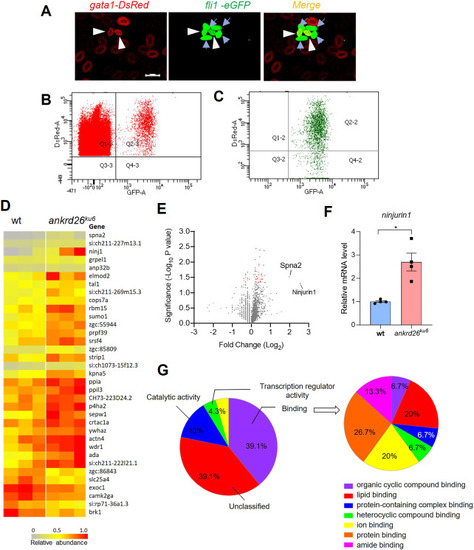
Differential proteomics in young thrombocytes of wt and ankrd26ku6 zebrafish. (A) Endogenous fluorescence labeling to differentiate erythrocytes (only in red), young thrombocytes (in both red and green as indicated by white arrowheads) and mature thrombocytes (only in green as indicated by blue arrows). (B) Flow cytometric gating for erythrocytes (Q1-3) and thrombocytes (Q2-3). (C) Purity of fluorescence-activated cell sorting-isolated young (Q2-2) and mature (Q4-2) thrombocytes. (D) Heat map showing the relative abundance of 35 ranked proteins identified in young thrombocytes of wt and ankrd26ku6 zebrafish. Ranking is based on fold change >1.25 (n=3). (E) Volcano plot demonstrating the fold change of 2425 proteins identified in young thrombocytes of wt and ankrd26ku6 zebrafish (n=3). Red dots represent 35 differentially expressed proteins with fold change >1.25 (P<0.05). (F) Quantification of ninjurin 1 mRNA levels in zebrafish larvae of different genotypes. (G) Molecular function of proteins with significant change in their expression in young thrombocytes of ankrd26ku6 zebrafish compared with those of wt controls.
|
