FIGURE SUMMARY
Title

The visuomotor transformations underlying target-directed behavior

Authors
Zhao, P., Tong, Y., Lazarte, I.P., Khan, B., Tian, G., Chen, K.K.Y., Lam, T.K.C., Hu, Y., Semmelhack, J.L.
Source
Full text @ Proc. Natl. Acad. Sci. USA

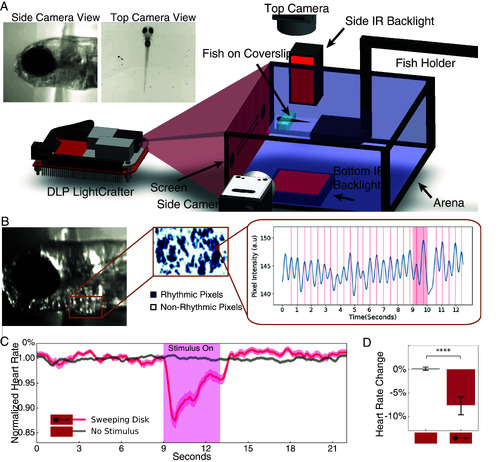
A large translating disk causes immobility and bradycardia. (A) Schematic of the experimental setup. (B) Identification of rhythmic pixels within the heart ROI and pixel intensity peaks corresponding to heart beats. (C) Normalized heart rate in response to sweep or no stimulus. Shading indicates SE. (D) Change in heart rate during the 3 s after stimulus onset. n = 14 larvae. Error bar = SD. ****, P < 0.0001, Mann–Whitney U test.

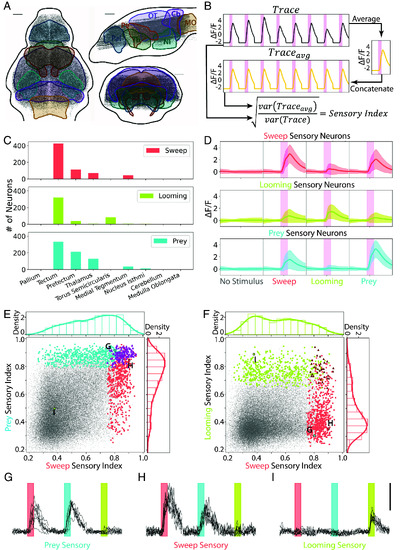
Identification of sensory neurons for sweep, prey, and looming stimuli. (A) Cell bodies in the imaging dataset (n = 7 larvae, 188,272 neurons). Pallium, Pal; Pretectum, Pt; Thalamus, Th; Optic Tectum, OT; Nucleus Isthmi, NI; Cerebellum, Cb; Medulla Oblongata, MO. (Scale bar, 50 µm.) (B) Calculation of the sensory index (SI) of each neuron. (C) Number of sensory neurons in each brain area. (D) The average response of each sensory neuron population to all stimuli. Pink bars = 4 s stimulus display. Shading indicates SD. (E) SI of all sweep (red), prey (blue), and prey + sweep (purple) sensory neurons, and all active neurons in the dataset (gray, 63,420 neurons). Density plots represent sensory neurons of each type. (F) SI of looming (green), sweep (red), and looming + sweep (brown) sensory neurons. (GI) Response of example sweep, prey, and looming sensory neurons selected near the mode (i.e., max density) of that population’s density plot. Red, blue, and green bars indicate 4 s sweep, prey, or looming stimuli. Scalebar indicates ΔF/F = 3.

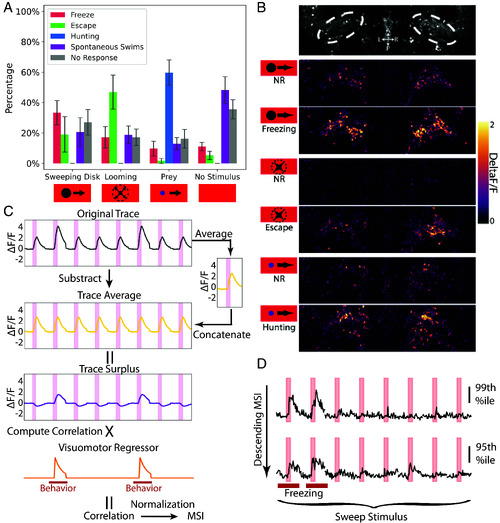
Identification of sensorimotor (SM) neurons for freezing, escape, and hunting. (A) Percent of trials with each behavioral response to the stimuli. The error bar represents SD. n = 7 larvae (B) Example responses of cell bodies in the NI to sweep, looming, and prey stimuli in no behavioral response (NR) and freezing, escape, and hunting trials. (C) Schematic calculation of freezing MSI for a neuron in a fish with freezing in the second and 6th trials. The trace average is subtracted from the original trace to generate the trace surplus, and then, the Pearson correlation between the trace surplus and the visuomotor regressor is computed to give the freezing motor surplus index (MSI) for that neuron. (D) Example ΔF/F neuronal traces during the eight sweep presentations from a larva with two freezing trials. Neurons are from the 99th and 95th percentile of the freezing MSI. Red bars indicate freezing trials.

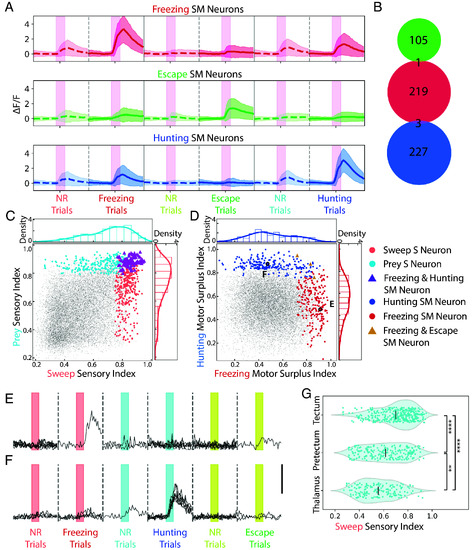
Functional properties and anatomical locations of sensorimotor (SM) neurons for freezing, escape, and hunting. (AC) Average calcium response of the sensory and SM neurons during behavior and no response trials. (D) The distribution of sweep sensory neurons (light red) and freezing SM neurons (dark red) on the sweep SI and freezing MSI. Crimson triangles: neurons belonging to both populations. (E) The distribution of the looming sensory neurons (light green) and escape SM neurons (dark green) on the looming SI and escape MSI. Gray triangles: neurons belonging to both populations. (F) The distribution of the prey sensory neurons (light blue) and hunting SM neurons (dark blue) on the prey SI and hunting MSI. Navy triangles: neurons belonging to both populations. (G) Response of example neuron with both high sweeping SI and freezing MSI, annotated in D. Light red bars: 4 s presentation of sweep stimuli. Dark red bars: trials with a freezing response. The scale bar indicates ΔF/F = 3. (H) Locations of SM neurons in the recording volume. Red: Freezing neurons. Green: Escape neurons. Blue: Hunting neurons. (Scale bar, 50 µm.) (I) Numbers of SM neurons in each brain area.

Sensory and sensorimotor neurons in the tectum. (A) Locations of the three types of SM neurons in the tectum. (Scale bar, 50 µm.) (B) Locations of SM neurons on the anterior/posterior and dorsal/ventral axes. (C and D) Locations of sweep sensory neurons (light red) and freezing SM neurons (dark red) in the tectum and their locations on the anterior/posterior and dorsal/ventral axes. (E and F) Locations of prey sensory neurons (light blue) and hunting SM neurons (dark blue) in the tectum and on the anterior/posterior and dorsal/ventral axes. (G and H) Locations of looming sensory neurons (light green) and escape SM neurons (green) in the tectum and their locations on the anterior/posterior and dorsal/ventral axes. (I) Hypotheses for the tectum S and SM connectivity in the sensorimotor circuit. (J) Percentage of SM neurons that were significantly correlated with the tectal sensory neurons. Colored dots represent values for individual fish. Parenthesis: total number of SM neurons of that type across all fish. NI = Percentage of SM neurons in the NI that were significantly correlated with tectal sensory neurons. Percentage-by-chance was 0% for both tectal and NI SM neurons (Methods). *, P < 0.05. **, P < 0.01, one-sided Wilcoxon signed-rank test. The P-values were 0.011 for freezing, 0.787 for escape, and 0.007 for hunting.

Functional segregation of the different types of sensorimotor neurons in the tectum. (A) Activities of tectal SM neurons during motor response or no response trials. Pink bars represent 4 s stimulus presentation. n = 7 larvae. Shading represents SD. (B) Venn diagram of the three SM neuron populations in the tectum. Green = escape SM, red = freezing SM, and blue = hunting SM neurons. (C) The distribution of the tectal sweep (light red) and prey (light blue) sensory neurons on the sweep and prey sensory index. Purple triangles: neurons belonging to both populations. (D) The distribution of tectal freezing (dark red) and hunting SM neurons (dark blue) on the MSI of freezing and hunting. Gold triangle: neuron belonging to both populations. (E and F) Responses of example tectal freezing and hunting SM neurons from D. The scale bar indicates ΔF/F = 3. (G) Distribution of the sweep sensory index of prey sensory neurons in the tectum, pretectum, and thalamus. Black lines indicate averages **, P < 0.01. ****, P < 0.0001, Kruskal–Wallis test, followed by Dunn’s test.

Acknowledgments
This image is the copyrighted work of the attributed author or publisher, and ZFIN has permission only to display this image to its users. Additional permissions should be obtained from the applicable author or publisher of the image. Full text @ Proc. Natl. Acad. Sci. USA