FIGURE

Fig. 2.

ID
ZDB-FIG-250417-89
Publication
Zhao et al., 2025 - The visuomotor transformations underlying target-directed behavior
Other Figures
All Figure Page
Back to All Figure Page
Fig. 2.

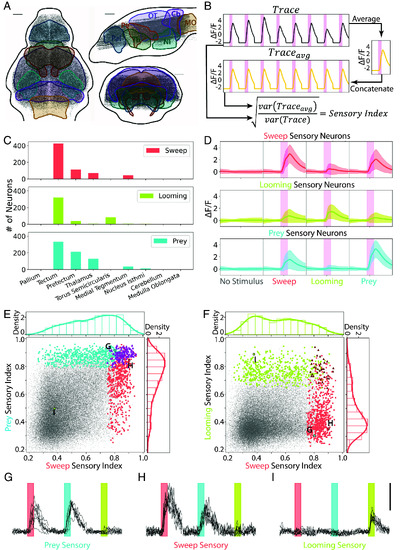
Identification of sensory neurons for sweep, prey, and looming stimuli. (A) Cell bodies in the imaging dataset (n = 7 larvae, 188,272 neurons). Pallium, Pal; Pretectum, Pt; Thalamus, Th; Optic Tectum, OT; Nucleus Isthmi, NI; Cerebellum, Cb; Medulla Oblongata, MO. (Scale bar, 50 µm.) (B) Calculation of the sensory index (SI) of each neuron. (C) Number of sensory neurons in each brain area. (D) The average response of each sensory neuron population to all stimuli. Pink bars = 4 s stimulus display. Shading indicates SD. (E) SI of all sweep (red), prey (blue), and prey + sweep (purple) sensory neurons, and all active neurons in the dataset (gray, 63,420 neurons). Density plots represent sensory neurons of each type. (F) SI of looming (green), sweep (red), and looming + sweep (brown) sensory neurons. (GI) Response of example sweep, prey, and looming sensory neurons selected near the mode (i.e., max density) of that population’s density plot. Red, blue, and green bars indicate 4 s sweep, prey, or looming stimuli. Scalebar indicates ΔF/F = 3.

Expression Data

Expression Detail
Antibody Labeling
Phenotype Data

Phenotype Detail
Acknowledgments
This image is the copyrighted work of the attributed author or publisher, and ZFIN has permission only to display this image to its users. Additional permissions should be obtained from the applicable author or publisher of the image. Full text @ Proc. Natl. Acad. Sci. USA