FIGURE

Fig. 3.

ID
ZDB-FIG-250417-90
Publication
Zhao et al., 2025 - The visuomotor transformations underlying target-directed behavior
Other Figures
All Figure Page
Back to All Figure Page
Fig. 3.

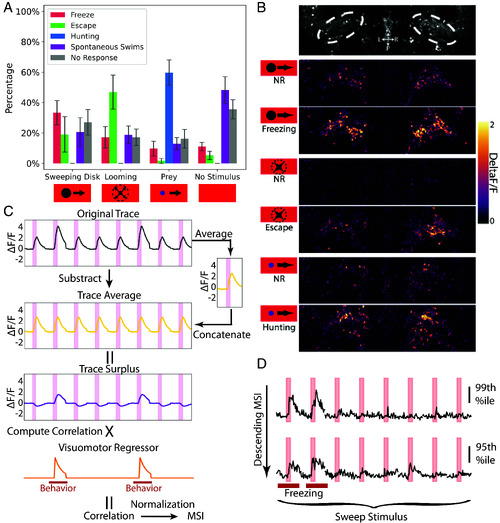
Identification of sensorimotor (SM) neurons for freezing, escape, and hunting. (A) Percent of trials with each behavioral response to the stimuli. The error bar represents SD. n = 7 larvae (B) Example responses of cell bodies in the NI to sweep, looming, and prey stimuli in no behavioral response (NR) and freezing, escape, and hunting trials. (C) Schematic calculation of freezing MSI for a neuron in a fish with freezing in the second and 6th trials. The trace average is subtracted from the original trace to generate the trace surplus, and then, the Pearson correlation between the trace surplus and the visuomotor regressor is computed to give the freezing motor surplus index (MSI) for that neuron. (D) Example ΔF/F neuronal traces during the eight sweep presentations from a larva with two freezing trials. Neurons are from the 99th and 95th percentile of the freezing MSI. Red bars indicate freezing trials.

Expression Data

Expression Detail
Antibody Labeling
Phenotype Data

Phenotype Detail
Acknowledgments
This image is the copyrighted work of the attributed author or publisher, and ZFIN has permission only to display this image to its users. Additional permissions should be obtained from the applicable author or publisher of the image. Full text @ Proc. Natl. Acad. Sci. USA