IMAGE

Fig. 6.

ID
ZDB-IMAGE-250417-97
Source
Figures for Zhao et al., 2025
Image
Figure Caption

Fig. 6.

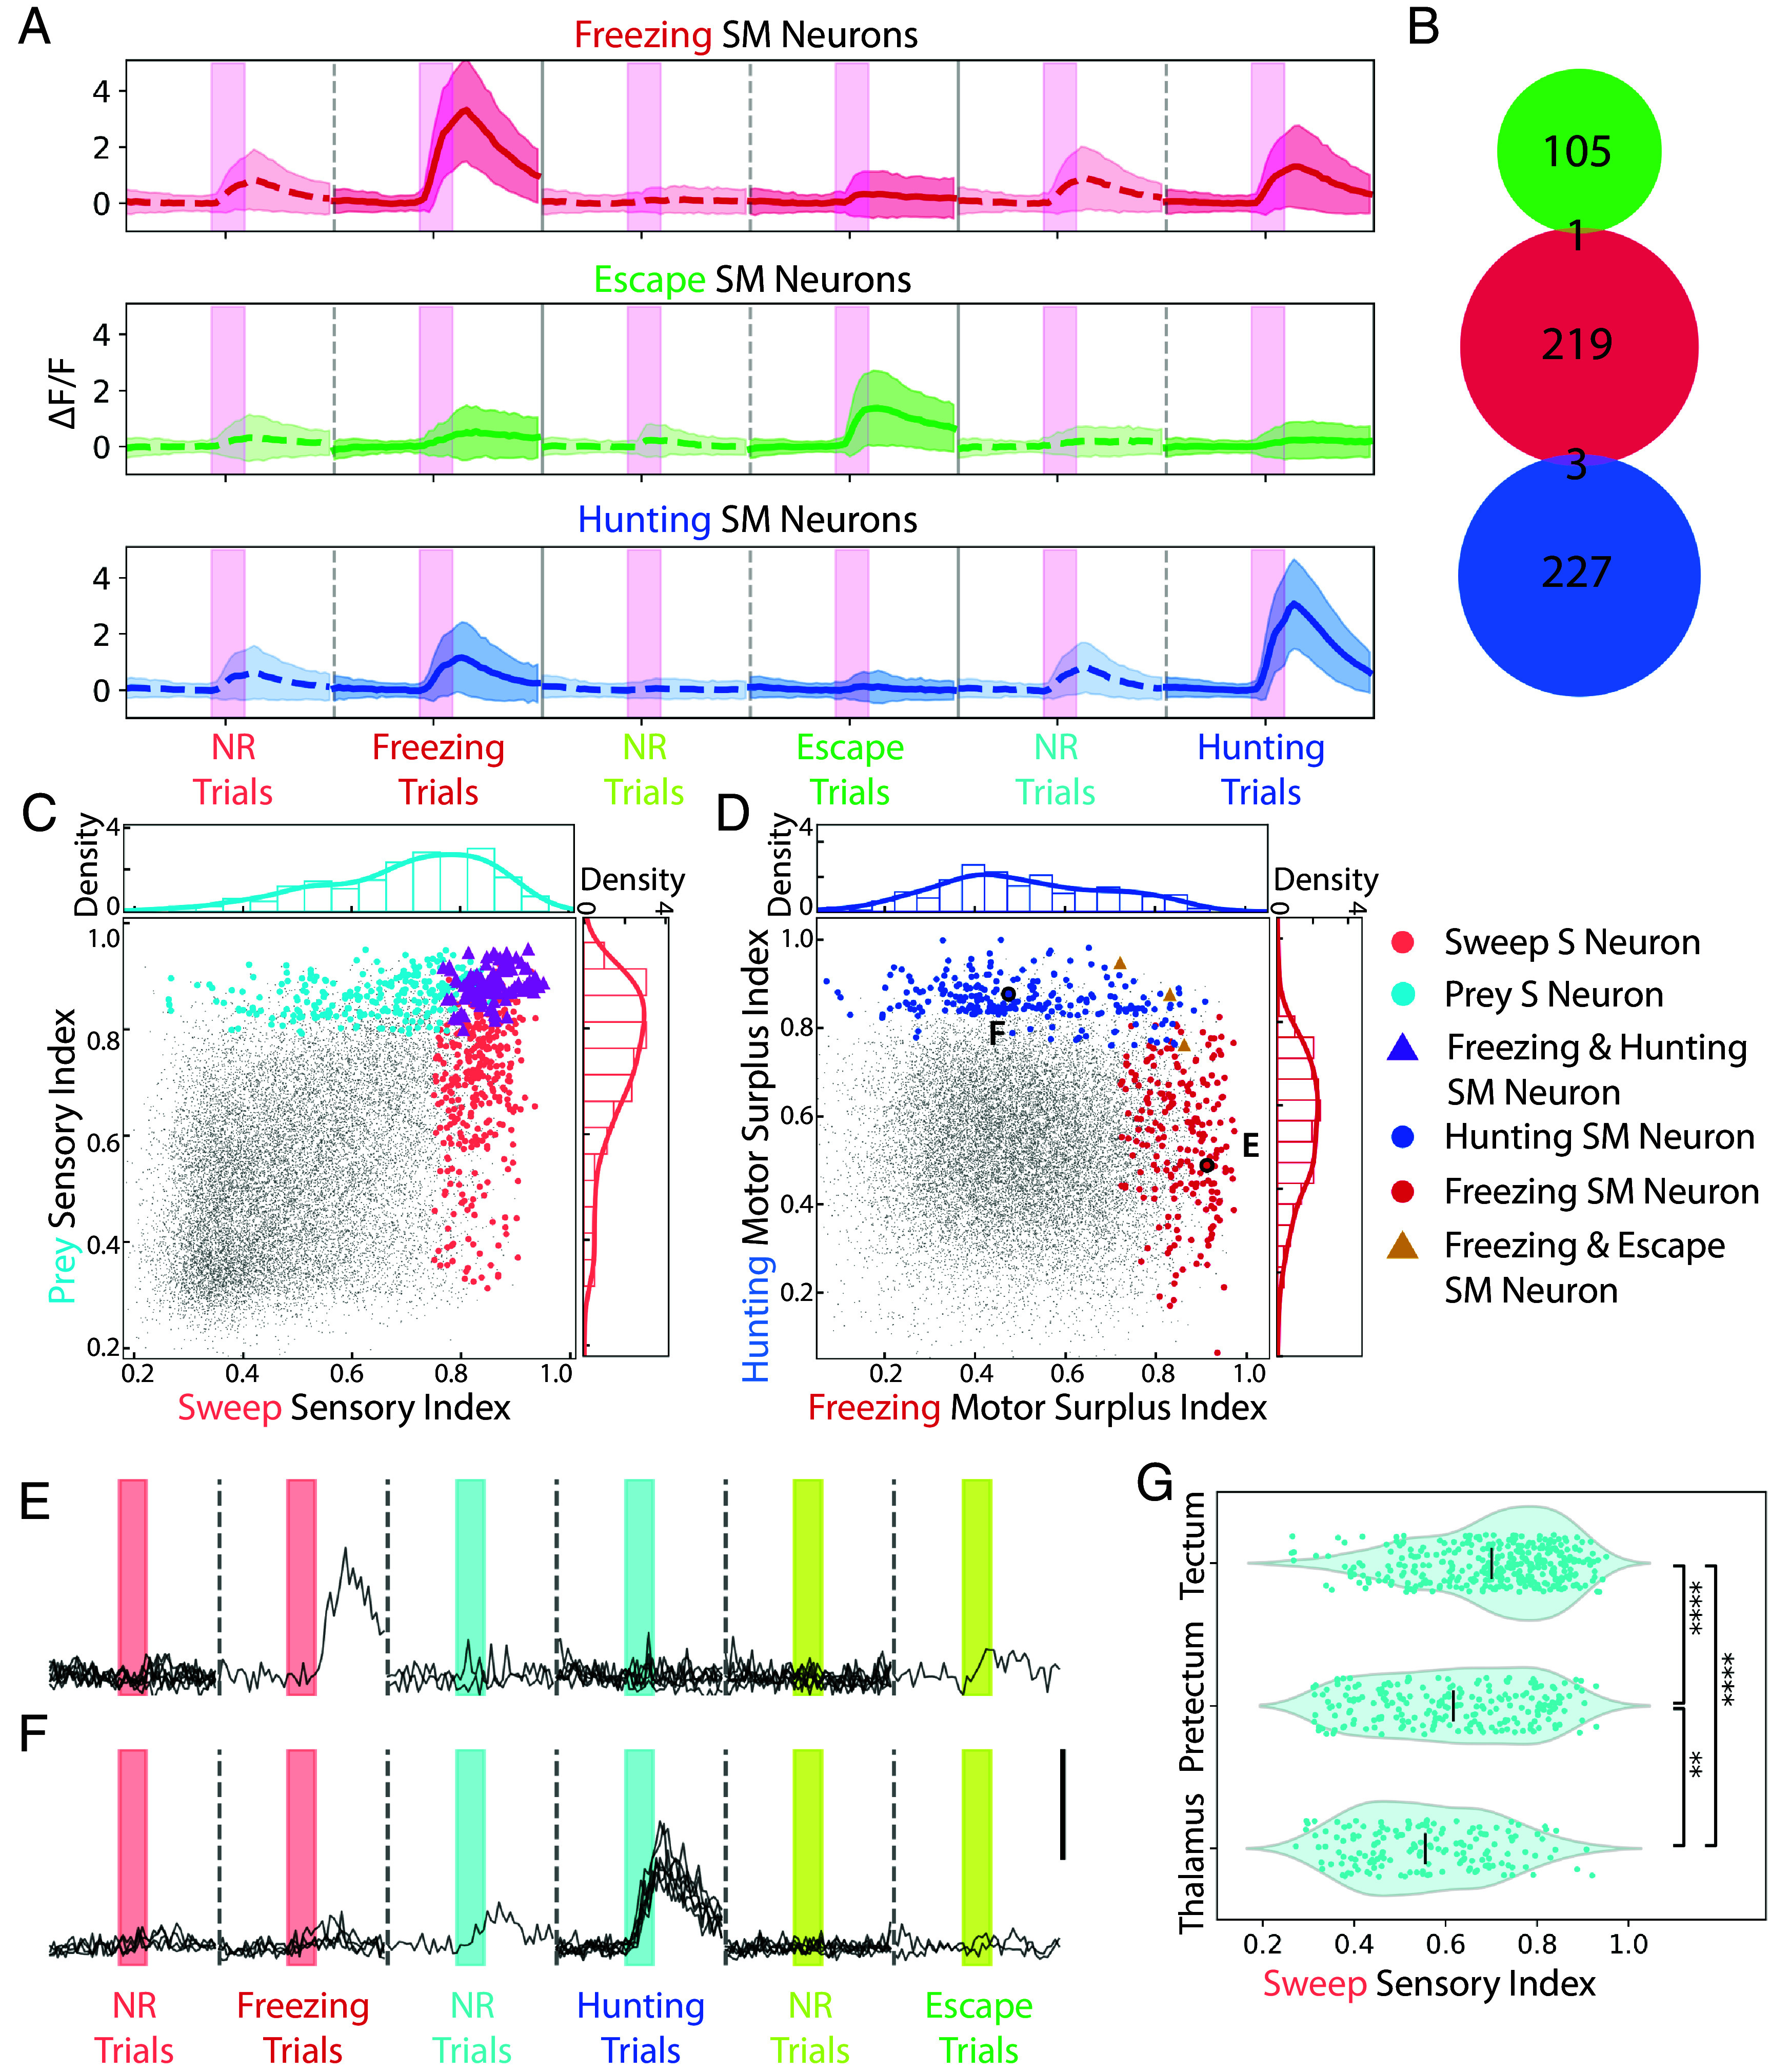
Functional segregation of the different types of sensorimotor neurons in the tectum. (A) Activities of tectal SM neurons during motor response or no response trials. Pink bars represent 4 s stimulus presentation. n = 7 larvae. Shading represents SD. (B) Venn diagram of the three SM neuron populations in the tectum. Green = escape SM, red = freezing SM, and blue = hunting SM neurons. (C) The distribution of the tectal sweep (light red) and prey (light blue) sensory neurons on the sweep and prey sensory index. Purple triangles: neurons belonging to both populations. (D) The distribution of tectal freezing (dark red) and hunting SM neurons (dark blue) on the MSI of freezing and hunting. Gold triangle: neuron belonging to both populations. (E and F) Responses of example tectal freezing and hunting SM neurons from D. The scale bar indicates ΔF/F = 3. (G) Distribution of the sweep sensory index of prey sensory neurons in the tectum, pretectum, and thalamus. Black lines indicate averages **, P < 0.01. ****, P < 0.0001, Kruskal–Wallis test, followed by Dunn’s test.

Acknowledgments
This image is the copyrighted work of the attributed author or publisher, and ZFIN has permission only to display this image to its users. Additional permissions should be obtained from the applicable author or publisher of the image. Full text @ Proc. Natl. Acad. Sci. USA