
- Title
-
Integration analysis of miRNA-mRNA uncovers the mechanisms of ochratoxin A-induced hepatotoxicity
- Authors
- Luo, Z., Jin, R., Pan, F., Guo, R., Li, M., Zhang, S., Shi, J., Zheng, J., Wang, H., Yang, X., Yang, J., Yu, G.
- Source
- Full text @ Ecotoxicol. Environ. Saf.

OTA inhibits proliferation and cell viability and induces cell cycle arrest in LO2 cells (A) Chemical structures of ochratoxin A. Viability assay via automatic cell counting: (B) Represented images, the green cells indicated live cells while the red cells indicated dead cells (n = 3); (C) Number (left) and ratio (right) of live cells at indicated concentrations (n = 3). (D) Changes in cell viability of LO2 cells after 48 h of incubation with OTA at indicated concentrations (n = 6). (E) Flow cytometry analysis of cell cycle distribution following 48 h of OTA treatment (n = 3). Data were presented as mean ± S.D. *p < 0.05, * *p < 0.01, * **p < 0.001, * ** *p < 0.0001 vs. vehicle group. |

OTA induces apoptosis and ROS production in LO2 cells (A) Annexin V-FITC/PI assay was used to measure apoptotic cell percentages, analyzed through flow cytometry (n = 3). (B) TUNEL assay was performed to detect apoptotic cells, with green fluorescence indicating TUNEL-positive apoptotic cells (n = 3). (C) JC-1 detection in LO2 cells was assessed by flow cytometry, with the dot plot showing gating for JC-1 (red)-aggregates and JC-1 (green)-monomer populations (n = 3). Changes in MMP were reflected by the percentage of fluorescent intensity, where an increase in the percentage of green fluorescence intensity indicated a reduction in MMP. (D) ROS generation was measured using DCFH-DA staining and analyzed via flow cytometry (n = 3). Data are presented as mean ± S.D. *p < 0.05, * ** *p < 0.0001 vs. vehicle group. |
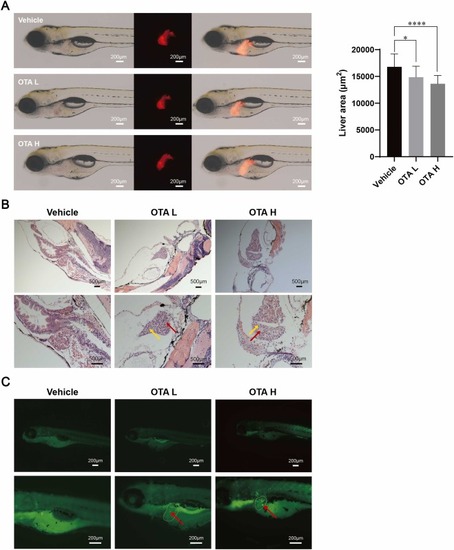
Hepatotoxicity of OTA in zebrafish. (A) Liver morphology of zebrafish following OTA exposure, with the fluorescence area of liver in red. Data are presented as mean ± S.D. *p < 0.05, * ** *p < 0.0001 vs. vehicle group (n = 18). (B) Hematoxylin and eosin staining of zebrafish liver tissues (n = 10). The red arrows indicated areas of vacuolation, while the yellow arrows highlighted damaged cells. (C) Apoptosis in the liver was assessed using acridine orange staining (n = 10). The red arrows indicated apoptotic cells. L: low dose; H: high dose. |
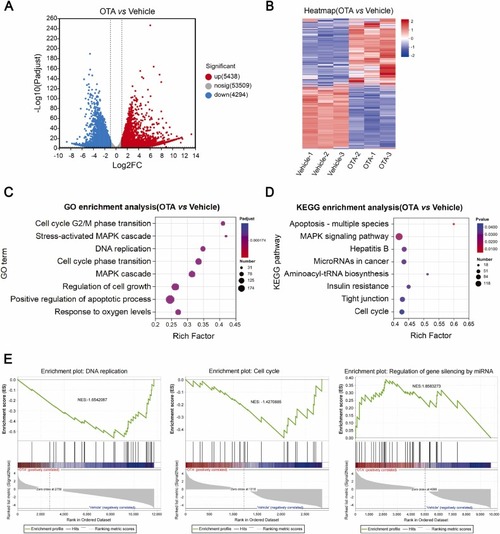
The results of mRNA-seq and bioinformatics analysis. (A) The volcano plot of DEGs from mRNA-seq analysis. (B) DEG expression heatmap. (C) GO: BP terms and (D) KEGG pathways identified by mRNA-seq analysis. (E) GSEA illustrating the enrichment of DNA replication, cell cycle and gene silencing via miRNA in LO2 cells treated with vehicle or OTA. NES, normalized enrichment score. |
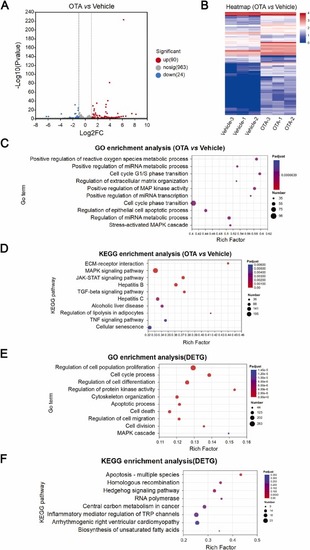
The results of miRNA-seq and bioinformatics analysis. (A) The volcano plot of DEMs from miRNA-seq analysis. (B) DEM expression heatmap. (C) GO: BP terms and (D) KEGG pathways identified by miRNA-seq analysis. (E) GO: BP terms and (F) KEGG pathway analysis of DETGs. |

Construction of the miRNA–mRNA regulatory network and validation of hub mRNA and miRNA expression levels using qRT-PCR. (A) Network depicting the interactions between DEMs and DETGs in LO2 cells. Diamonds representing mRNAs and circles representing miRNAs, with edges indicating the targeting relationship. (B) Heatmap depicting mRNA expression profiles analyzed by qRT-PCR in response to OTA treatment. (C) Heatmap illustrating miRNA expression profiles analyzed by qRT-PCR following OTA exposure. mRNA levels were normalized to β-actin, while miRNA levels were standardized to U6. |