
FIGURE
Fig. 3
- ID
- ZDB-FIG-250423-52
- Publication
- Luo et al., 2025 - Integration analysis of miRNA-mRNA uncovers the mechanisms of ochratoxin A-induced hepatotoxicity
- Other Figures
- All Figure Page
- Back to All Figure Page
Fig. 3
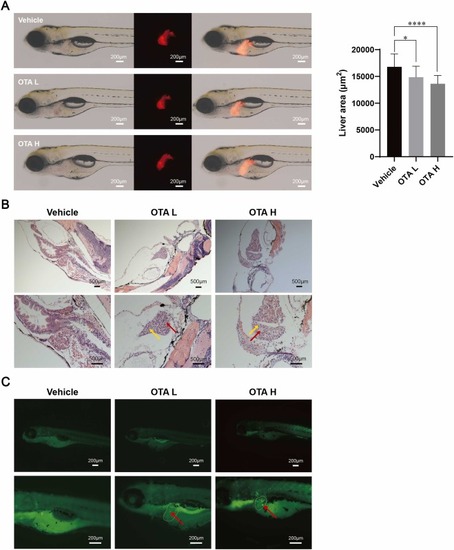
Hepatotoxicity of OTA in zebrafish. (A) Liver morphology of zebrafish following OTA exposure, with the fluorescence area of liver in red. Data are presented as mean ± S.D. *p < 0.05, * ** *p < 0.0001 vs. vehicle group (n = 18). (B) Hematoxylin and eosin staining of zebrafish liver tissues (n = 10). The red arrows indicated areas of vacuolation, while the yellow arrows highlighted damaged cells. (C) Apoptosis in the liver was assessed using acridine orange staining (n = 10). The red arrows indicated apoptotic cells. L: low dose; H: high dose. |
Expression Data
Expression Detail
Antibody Labeling
Phenotype Data
Phenotype Detail
Acknowledgments
This image is the copyrighted work of the attributed author or publisher, and
ZFIN has permission only to display this image to its users.
Additional permissions should be obtained from the applicable author or publisher of the image.
Full text @ Ecotoxicol. Environ. Saf.