
FIGURE
Fig. 4
- ID
- ZDB-FIG-250423-53
- Publication
- Luo et al., 2025 - Integration analysis of miRNA-mRNA uncovers the mechanisms of ochratoxin A-induced hepatotoxicity
- Other Figures
- All Figure Page
- Back to All Figure Page
Fig. 4
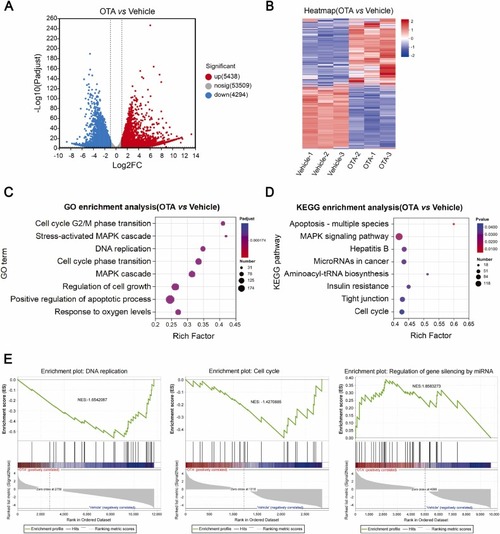
The results of mRNA-seq and bioinformatics analysis. (A) The volcano plot of DEGs from mRNA-seq analysis. (B) DEG expression heatmap. (C) GO: BP terms and (D) KEGG pathways identified by mRNA-seq analysis. (E) GSEA illustrating the enrichment of DNA replication, cell cycle and gene silencing via miRNA in LO2 cells treated with vehicle or OTA. NES, normalized enrichment score. |
Expression Data
Expression Detail
Antibody Labeling
Phenotype Data
Phenotype Detail
Acknowledgments
This image is the copyrighted work of the attributed author or publisher, and
ZFIN has permission only to display this image to its users.
Additional permissions should be obtained from the applicable author or publisher of the image.
Full text @ Ecotoxicol. Environ. Saf.