FIGURE SUMMARY
Title

LIPUS Promotes Calcium Oscillation and Enhances Calcium Dependent Autophagy of Chondrocytes to Alleviate Osteoarthritis

Authors
Guan, M., Han, X., Liao, B., Han, W., Chen, L., Zhang, B., Peng, X., Tian, Y., Xiao, G., Li, X., Kuang, L., Zhu, Y., Bai, D.
Source
Full text @ Adv Sci (Weinh)

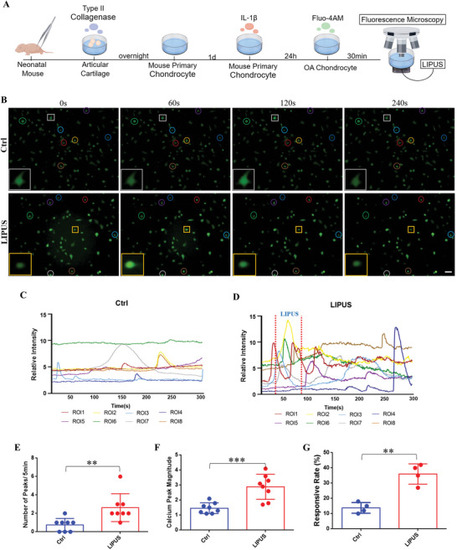
LIPUS activates Ca2+ signaling of inflammatory chondrocyte. A) Schematic of the inflammatory chondrocyte establishment and the real‐time calcium imaging with LIPUS. B) The real‐time fluorescence intensity images of chondrocyte at different time point in the same field of view (Circles of the same color represent the same cell, and square represent the typical cell in this field of view). Scale bar, 10 µm. Calcium transient relative fluorescence intensity of chondrocyte without C) and with D) LIPUS. Quantification of the number E) (n = 8), the magnitude F) (n = 8) of calcium peaks, and the responsive rate of cells G) (n = 4). Data are presented as means ± SD. Statistical analysis was performed using Student's t test. ***(P < 0.001), **(P < 0.01).

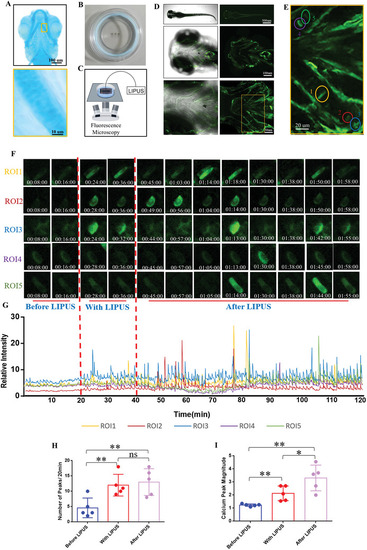
LIPUS promotes chondrocyte calcium oscillation of living zebrafish. A) Alcian blue staining to label the cranial cartilage structure of zebrafish juveniles. B) Zebrafish larvae were immobilized in a confocal dish with low‐melting‐point agarose. C) Schematic of the real‐time LIPUS‐processed calcium imaging under a confocal microscope. D) The whole fish, cranial and ceratohyal observed under a confocal microscope. E) 5 chondrocytes were circled with different colors as ROIs. F) The real‐time fluorescence intensity of the five ROIs. G) Calcium transient relative fluorescence intensity of ROIs. Quantification of the number H) (n = 5), the magnitude I) (n = 5) of calcium peaks. Data are presented as means ± SD. Statistical analysis was performed using Student's t test. **(P < 0.01), *(P < 0.05), ns (0.05 < P).

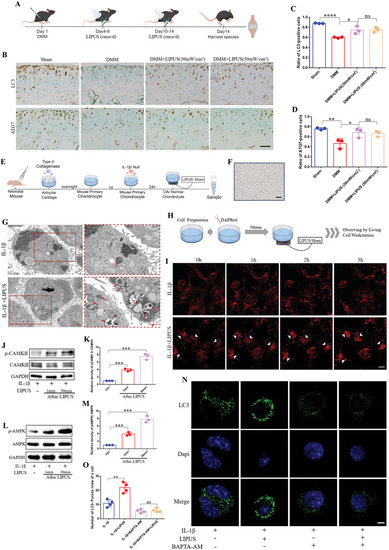
LIPUS up‐regulates chondrocyte autophagy in a calcium pathway‐dependent manner. A) Schematic of the mouse experiment procedures. B) Immunohistochemical staining of LC3 and ATG7 in the articular cartilage. Scale bar, 50 µm. Quantification of LC3‐positive cells C) and ATG7‐positive cells D) (n = 3 mice). E) Schematic of the inflammatory chondrocyte establishment and treating with LIPUS. F) The chondrocytes we have obtained observing by microscope. Scale bar, 20µm. G) TEM was used for detection the autophagosomes in chondrocytes following LIPUS treatment. Red arrowhead indicates an autophagosome. Scale bar, 1 µm. H) Observation the autophagy flux of living chondrocyte labeled by DAPRed. I) Autophagy flux was dynamically observed by DAPRed at different time point after LIPUS. White arrowhead indicates the significant changes. Scale bar, 10 µm. WB (J) and densitometry analysis (K) of CAMK II protein expression following LIPUS treatment (n = 3). WB L) and densitometry analysis M) of AMPK protein expression following LIPUS treatment at different time point (n = 3). N) Immunofluorescence was used to detect the LC3‐puncta after the chondrocytes was co‐incubated with BAPTA‐AM. Scale bar, 5 µm. O) Quantification of LC3‐puncta in chondrocytes (n = 4). Data are presented as means ± SD. Statistical analysis was performed using Student's t test. ****(P < 0.0001), ***(P < 0.001), **(P < 0.01), *(P < 0.05), ns (0.05 < P).

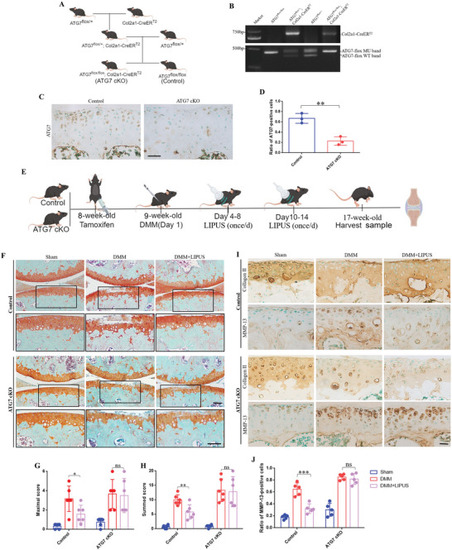
LIPUS maintains cartilage homeostasis depending on autophagy. A) Reproductive strategies for transgenic mice. B) Genotyping by PCR to confirm the Cre recombinase and homozygous floxed ATG7 in product. C)ATG7 deletion was confirmed by immunohistochemistry of the articular cartilage. Scale bar, 50 µm. D) Quantification of ATG7‐positive cells in the articular cartilage (n = 3 mice). E) Schematic of the transgenic mice experiment procedures. F) Safranin O–Fast Green staining of the knee joint after LIPUS in ATG7cKO and control mice. Scale bar, 100 µm. The joint degradation was evaluated histologically by the OARSI recommended scoring system. Maximal scores G) and summed score H) were calculated for the MTP (n = 6 mice). I) Immunohistochemical staining of Collagen II and MMP‐13 in the articular cartilage of ATG7cKO and control mice. Scale bar, 20 µm. J) Quantification of MMP‐13‐positive cells (n = 5 mice). Data are presented as means ± SD. Statistical analysis was performed using Student's t test. ***(P < 0.001), **(P < 0.01), *(P < 0.05), ns (0.05 < P).

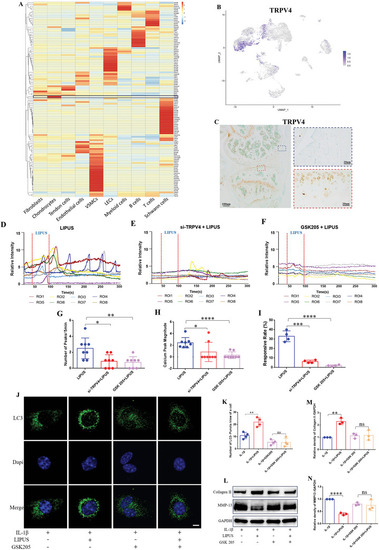
TRPV4 mediated Ca2+ signaling participates the regulation of LIPUS to inflammatory chondrocyte. A) Heatmap showing ion channel gene expression in all cells from the mouse ACLR model of PTOA. B) The express distribution of TRPV4 in UMAP plots. C) Immunohistochemical staining of TRPV4 in the mouse knee joint. Calcium transient relative fluorescence intensity of ROIs with LIPUS stimuli in control group D), in TRPV4‐knockdown group E), and in the TRPV4‐blocked group F). Quantification of the number G) (n = 8), the magnitude H) (n = 8) of calcium peaks, and the responsive rate of cells I) (n = 4). J) Immunofluorescence was used to detect the LC3‐puncta after the chondrocytes was co‐incubated with GSK205. Scale bar, 5 µm. K) Quantification of LC3‐puncta in chondrocytes (n = 4). WB L) and densitometry analysis of Collagen II M) and MMP‐13 N) protein expression of chondrocyte co‐incubated with GSK205 following LIPUS treatment (n = 3). Data are presented as means ± SD. Statistical analysis was performed using Student's t test. ****(P < 0.0001), ***(P < 0.001), **(P < 0.01), *(P < 0.05), ns (0.05 < P).

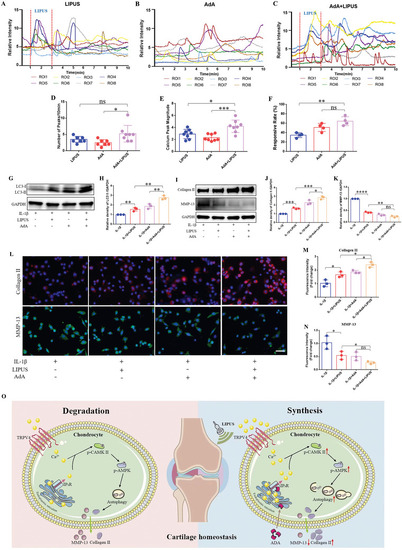
The intracellular calcium agonist AdA has a synergistic effect with LIPUS in regulating inflammatory chondrocyte. Calcium transient relative fluorescence intensity of ROIs in LIPUS alone A), in AdA alone B), in the combination of LIPUS and AdA C). Quantification of the number D) (n = 8), the magnitude E) (n = 8) of calcium peaks, and the responsive rate of cells F) (n = 4). WB G) and densitometry analysis of LC3 H) protein expression of chondrocyte co‐incubated with AdA following LIPUS treatment (n = 3). WB I) and densitometry analysis of Collagen II J) and MMP‐13 K) protein expression of chondrocyte co‐incubated with AdA following LIPUS treatment (n = 3). L) Immunofluorescence was used to detect the expression of Collagen II and MMP‐13 after the chondrocytes was co‐incubated with AdA. Scale bar, 20µm. Quantification the relative fluorescent intensity of Collagen II M) and MMP‐13 N) in chondrocytes (n = 3). O) Schematic diagram of LIPUS alleviates OA via calcium signaling‐dependent autophagy of chondrocyte. Data are presented as means ± SD. Statistical analysis was performed using Student's t test. ****(P < 0.0001), ***(P < 0.001), **(P < 0.01), *(P < 0.05), ns (0.05 < P).

Acknowledgments
This image is the copyrighted work of the attributed author or publisher, and ZFIN has permission only to display this image to its users. Additional permissions should be obtained from the applicable author or publisher of the image. Full text @ Adv Sci (Weinh)