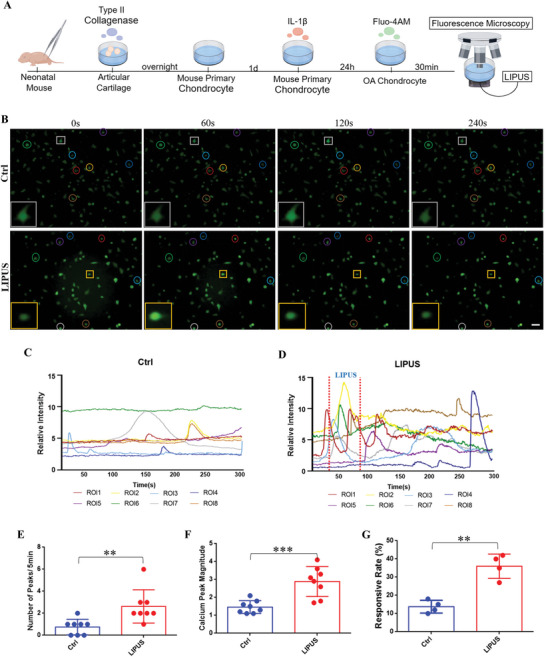
IMAGE

Figure 1

ID
ZDB-IMAGE-250426-34
Source
Figures for Guan et al., 2025
Image
Figure Caption

Figure 1

LIPUS activates Ca2+ signaling of inflammatory chondrocyte. A) Schematic of the inflammatory chondrocyte establishment and the real‐time calcium imaging with LIPUS. B) The real‐time fluorescence intensity images of chondrocyte at different time point in the same field of view (Circles of the same color represent the same cell, and square represent the typical cell in this field of view). Scale bar, 10 µm. Calcium transient relative fluorescence intensity of chondrocyte without C) and with D) LIPUS. Quantification of the number E) (n = 8), the magnitude F) (n = 8) of calcium peaks, and the responsive rate of cells G) (n = 4). Data are presented as means ± SD. Statistical analysis was performed using Student's t test. ***(P < 0.001), **(P < 0.01).

Acknowledgments
This image is the copyrighted work of the attributed author or publisher, and ZFIN has permission only to display this image to its users. Additional permissions should be obtained from the applicable author or publisher of the image. Full text @ Adv Sci (Weinh)