
- Title
-
UV-irradiated rotifers for the maintenance of gnotobiotic zebrafish larvae
- Authors
- Márquez Rosales, S., Bouchard, P.I., Olmstead, E.M., Parthasarathy, R.
- Source
- Full text @ mSphere
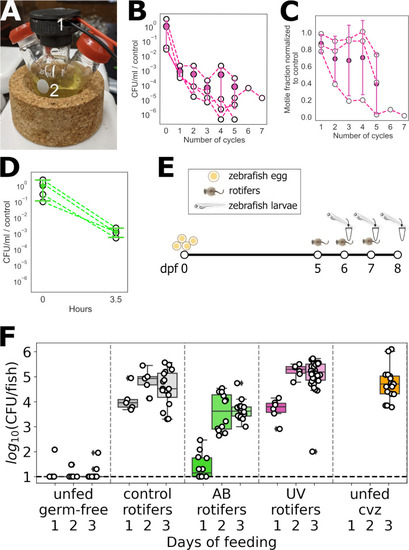
(A) Experimental setup for UV irradiation of rotifers, including (1) a UV-C LED mounted in a cap of a round bottom flask and (2) rotifers in a 4 ppt NaCl solution. (B) Bacterial concentration in the rotifer suspension as a function of the number of UV exposure cycles, each 30 minutes on/30 minutes off. (C) Fraction of motile rotifers as a function of the number of UV exposure cycles. In panels B and C, open symbols represent different replicates, and solid symbols and error bars indicate the mean and SD. (D) Bacterial concentration in the rotifer suspension before and after incubation with antibiotics for 3.5 hours. (E) Schematic diagram of the protocol for assessing bacterial load in initially germ-free zebrafish subject to different feeding methods. (F) Bacterial abundance per larval zebrafish after 1, 2, and 3 days of feeding with rotifers under different treatments, or unfed at the same days. Each symbol indicates a measurement from an individual fish; boxes indicate the median (line within the box), first and third quartiles (top and bottom of the box), and 95% confidence intervals (bars). The dashed line indicates the approximate limit of detection, 10 bacteria per fish. |
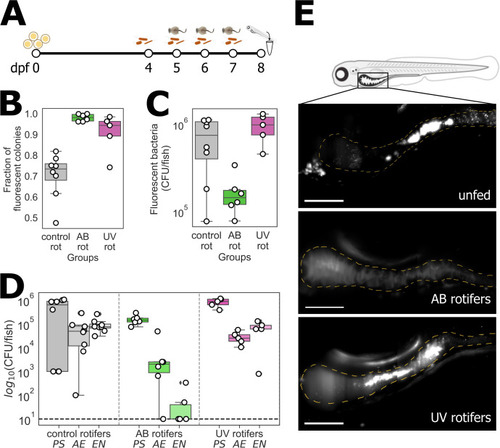
(A) Schematic diagram of the protocol to evaluate the permanence of gnotobiotic larvae after 3 days of feeding, in which initially germ-free zebrafish is inoculated with three fluorescently labeled bacterial species. (B) Fraction of fluorescent colonies from plating whole larvae, indicating the fraction of intentionally inoculated bacteria, after 3 days of feeding and re-inoculation. (C) Total abundance of fluorescent bacteria per larva after 3 days of feeding and re-inoculation. (D) Abundance of each intentionally inoculated strain. PS: |
(A) Schematic diagram of the protocol to evaluate |
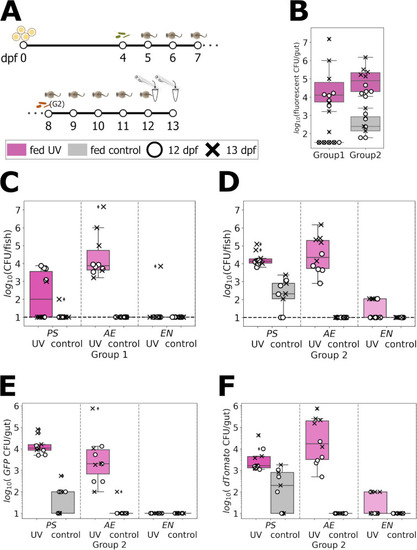
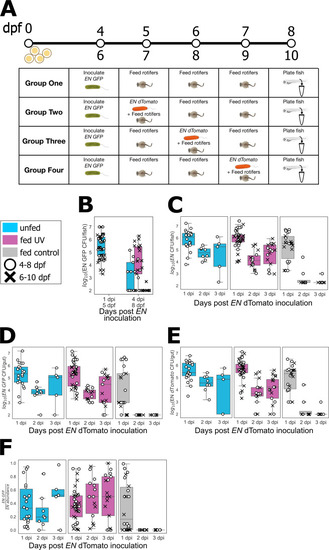
(A) Schematic diagram of the protocol to evaluate the stability of multiple bacterial species in larvae fed until 13 dpf. Initially germ-free larvae were inoculated with GFP-labeled PS, AE, and EN at 4 dpf and split into two groups. Zebrafish in group 2 was re-inoculated with dTomato-labeled PS, AE, and EN at 8 dpf. Both groups were fed from 5 to 11 or 12 dpf and homogenized and plated at 12 or 13 dpf. (B) Fluorescent bacterial abundance per larva after 7 or 8 days of feeding. Pink corresponds to larvae fed with UV treated rotifers and gray to larvae fed with untreated rotifers. (C and D) Bacterial abundance of each inoculated per strain for fish in groups 1 (C) and 2 (D). (E) Total abundance of GFP-labeled bacteria, descended from initial colonizers, of each strain in larvae from group 2. (F) Total abundance of dTomato-labeled bacteria, descended from later colonizers, in larvae from group 2. |