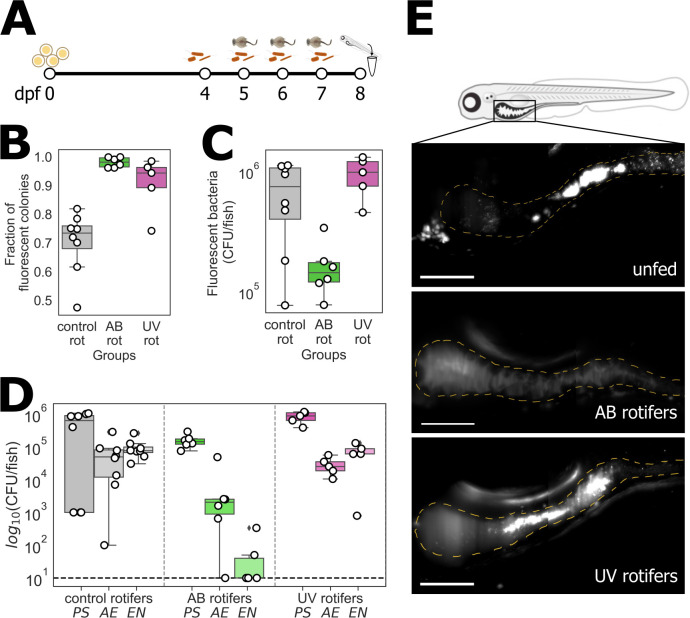
IMAGE

Fig 2

ID
ZDB-IMAGE-250327-158
Source
Figures for Márquez Rosales et al., 2025
Image
Figure Caption

Fig 2

(A) Schematic diagram of the protocol to evaluate the permanence of gnotobiotic larvae after 3 days of feeding, in which initially germ-free zebrafish is inoculated with three fluorescently labeled bacterial species. (B) Fraction of fluorescent colonies from plating whole larvae, indicating the fraction of intentionally inoculated bacteria, after 3 days of feeding and re-inoculation. (C) Total abundance of fluorescent bacteria per larva after 3 days of feeding and re-inoculation. (D) Abundance of each intentionally inoculated strain. PS: Pseudomonas mendocina ZWU0006, AE: Aeromona veronii ZOR0001, EN: Enterobacter cloacae ZOR0014. In panels B–D, each symbol indicates a measurement from an individual fish; boxes indicate the median and quartiles. (E) Maximum intensity projections of representative 3D image stacks from light sheet fluorescence microscopy of the guts of live larval fish, taken after 1 day of feeding with antibiotic- or UV-treated rotifers, or on the equivalent day for unfed fish. Each image is assembled from four or five scans of sub-regions that together span the whole gut, computationally registered after acquisition as described in Materials and Methods. Dashed lines trace approximate intestinal boundaries. Bar = 200 µm.

Acknowledgments
This image is the copyrighted work of the attributed author or publisher, and ZFIN has permission only to display this image to its users. Additional permissions should be obtained from the applicable author or publisher of the image. Full text @ mSphere