IMAGE

Fig 3

ID
ZDB-IMAGE-250327-159
Source
Figures for Márquez Rosales et al., 2025
Image
Figure Caption

Fig 3

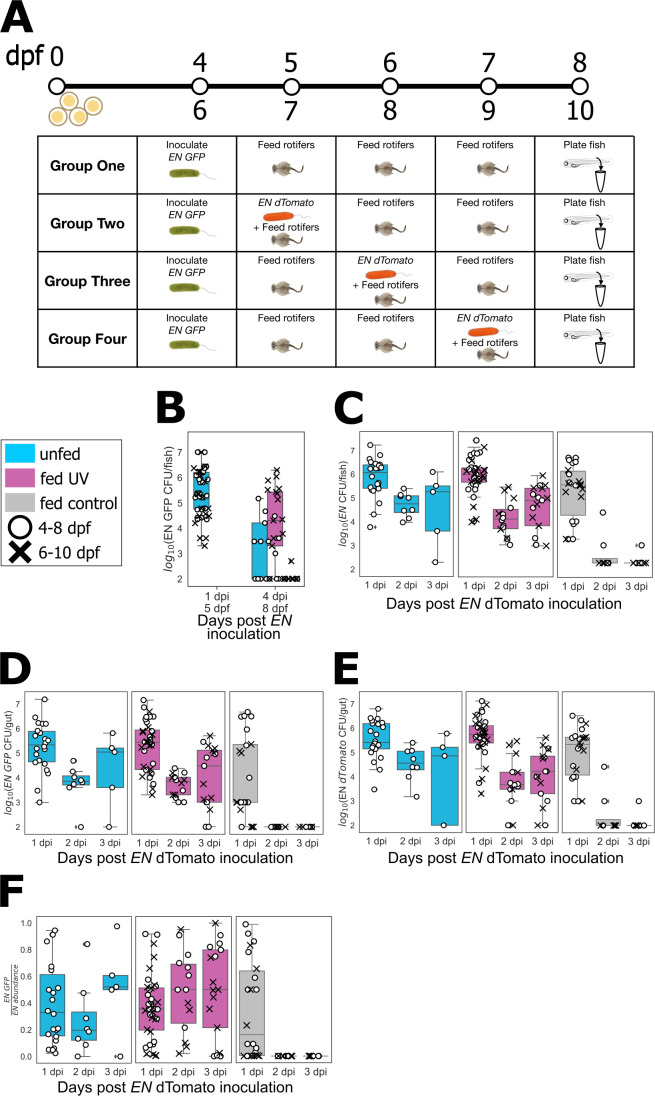
(A) Schematic diagram of the protocol to evaluate Enterobacter stability after feeding and re-inoculation. As described in the main text, initially germ-free fish were inoculated with GFP-labeled EN and fed UV-treated or control rotifers or left unfed for 3 days, starting at 4 or 6 dpf. Groups 2–4 were re-inoculated with dTomato-labeled EN on different days. (B–F) Final EN abundance in unfed larvae (cyan), larvae fed with UV-treated rotifers (pink), and larvae fed with untreated rotifers (gray). Circles represent data from larvae fed from 5 to 7 dpf and crosses from 7 to 9 dpf. (B) Fluorescent EN-GFP abundance in group 1 larvae assessed 1 day post-inoculation (before the start of feeding) and 4 days post-inoculation (after 3 days of feeding). (C–E) From groups 2, 3, and 4, total fluorescent EN abundance (GFP and dTomato) (C), EN-GFP abundance (D), and EN-dTomato abundance (E) 1, 2, or 3 days post EN dTomato inoculation. (F) Fraction of EN-GFP relative to the total EN abundance 1, 2, or 3 days post EN-dTomato inoculation.

Acknowledgments
This image is the copyrighted work of the attributed author or publisher, and ZFIN has permission only to display this image to its users. Additional permissions should be obtained from the applicable author or publisher of the image. Full text @ mSphere