
- Title
-
Loss of the epithelial transcription factor grhl3 leads to variably penetrant developmental phenotypes in zebrafish
- Authors
- Mathiyalagan, N., Johnson, T.K., Di Pastena, Z., Fuller, J.N., Miles, L.B., Dworkin, S.
- Source
- Full text @ Dev. Dyn.
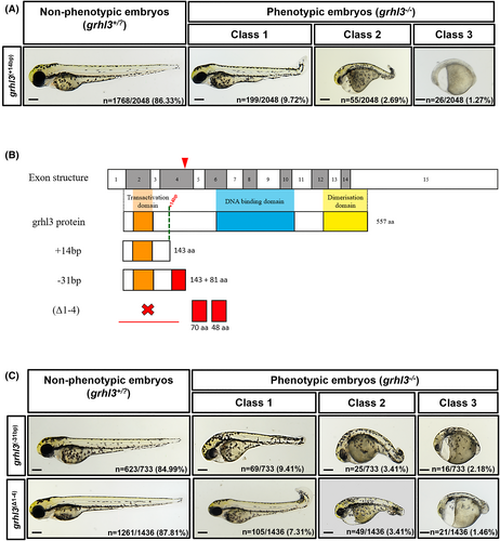
Characterization of grhl3−/−(+14bp) mutants. (A) Three distinct phenotypes of grhl3−/−(+14bp) embryos are present at 72 hpf (classified as class 1, class 2, and class 3 based on the severity and incidence of phenotypes). (B) Structure of a functional Grhl protein comprising 557 amino acids, showing transactivation domain (orange), DNA binding domain (blue), and dimerization domain (yellow) relative to predicted non-functional proteins produced following CRISPR/Cas 9-mediated deletion in grhl3−/−(+14bp), grhl3−/−(−31bp), and grhl3−/−(Δ1-4) zebrafish. The grhl3 mutants were generated by targeting exon 4 at a site lying 3′ to seven putative in-frame ATG-initiation codons (indicated by red arrow) via CRISPR/Cas 9 mediated deletion and homologous integration. (C) The three distinct phenotypes (class1-3) of grhl3−/−(−31bp) and grhl3−/−(Δ1-4) embryos at 72 hpf. Scale bars: 200 μm. |
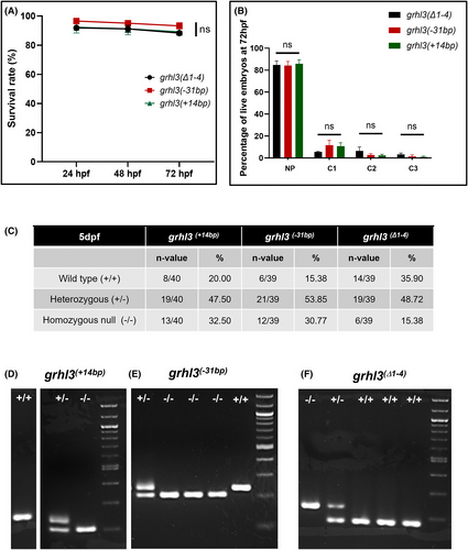
Survival rates and genotypes of embryos derived from inter-crossing grhl3+/− zebrafish of all three lines. (A) Comparison of survival rate of embryos derived from inter-crossing the grhl3+/−(+14bp), grhl3+/−(−31bp), and grhl3+/−(Δ1-4) lines. (B) Comparison of the phenotypic incidence of class 1, class 2, and class 3 phenotypes in grhl3−/−(+14bp), grhl3−/−(−31bp), and grhl3−/−(Δ1-4) embryos at 72 hpf. (C) Percentage of heterozygous, homozygous null, and WT larvae present at 5 dpf in a representative sample of 39–40 embryos. (D–F) Representative genotyping experiments showing the presence of wild type (+/+), heterozygous (+/−), and homozygous null (−/−) embryos of grhl3(+14bp), grhl3(−31bp), and grhl3(Δ1-4) lines. |
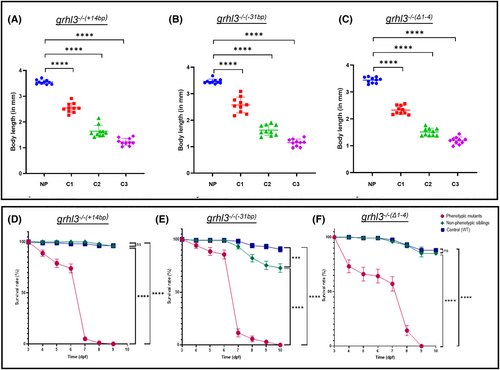
Maximum body length and survival age quantitation of grhl3−/− embryos. (A–C) Quantitation of body length of class 1, class 2, and class 3 grhl3−/−(+14 bp), grhl3−/−(−31bp), and grhl3−/−(Δ1-4) embryos. Data are represented as mean ± SEM; n = 10. (D–F) Maximum survival age of grhl3−/−(+14bp), grhl3−/−(−31 bp), and grhl3−/−(Δ1-4) embryos. ***p <.005; ****p <.001; ns, non-significant. Statistical significance determined by Student's t-tests. |
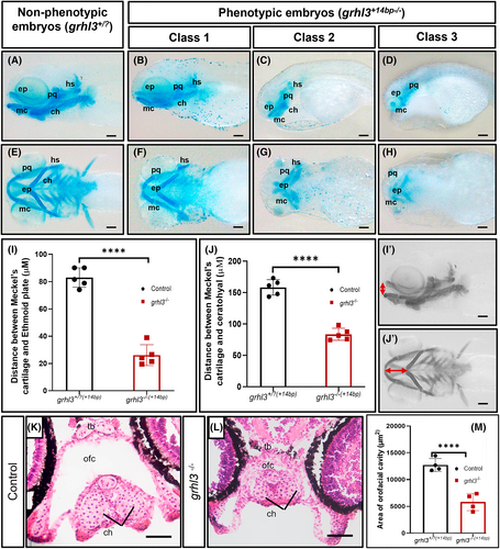
Craniofacial development in grhl3−/−(+14 bp) embryos at 4 dpf. (A–H) Class 1, class 2, and class 3 grhl3−/−(+14bp) embryos and non-phenotypic siblings (4 dpf) stained with Alcian blue, showing lateral (A–D) and ventral (E–H) views of the craniofacial cartilage (palatoquadrate [pq], ceratohyal [ch] Meckel's cartilage [mc], ethmoid plate [ep], and hyosymplectic [hs]). (I-I') The height between Meckel's cartilage and ethmoid plate (indicated by vertical double-headed red arrow) and (J-J') the distance between Meckel's cartilage and ceratohyal (indicated by horizontal double-headed red arrow) were measured and analyzed in grhl3−/−(+14bp) embryos and non-phenotypic siblings. (K, L) H&E staining of transverse sections across the rostral region of 7 dpf class 1 grhl3−/− mutant and control embryos (ceratohyal [ch] trabecular bar, orofacial cavity [ofc]). (M) Orofacial cavity area of grhl3−/− and control embryos. Data are shown as mean ± SEM; n = 5. Statistical significance determined by Student's t-test ****p <.001. Scale bars: 100 μm (A-J'), 50 μm (K, L). |
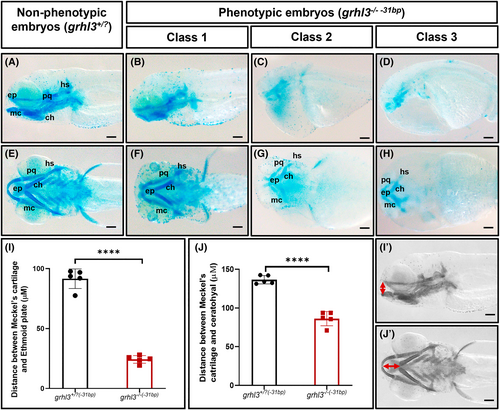
Craniofacial development in grhl3−/−(−31 bp) embryos at 4 dpf. (A–H) Class 1, class 2, ad class 3 grhl3−/−(−31bp) embryos and non-phenotypic siblings (4 dpf) stained with Alcian blue, showing lateral (A–D) and ventral (E–H) views of the craniofacial cartilage (palatoquadrate [pq], ceratohyal [ch] Meckel's cartilage [mc], ethmoid plate [ep], hyosymplectic [hs]). (I-I') The height between Meckel's cartilage and ethmoid plate (indicated by vertical double-headed red arrow) and (J-J') the distance between Meckel's cartilage and ceratohyal (indicated by horizontal double-headed red arrow) were measured and analyzed in grhl3−/−(−31bp) embryos and non-phenotypic siblings. Data are shown as mean ± SEM; n = 5. Statistical significance determined by Student's t-test ****p <.001. Scale bars: 100 μm (A-J'). |
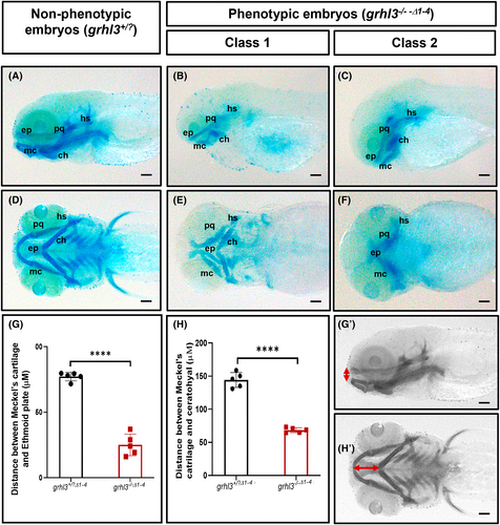
Craniofacial development in grhl3−/−(Δ1-4) embryos at 4 dpf. (A–H) Class 1, class 2, and class 3 grhl3−/−(Δ1-4) embryos and non-phenotypic siblings (4 dpf) stained with Alcian blue, showing lateral (A–D) and ventral (E–H) views of the craniofacial cartilage (palatoquadrate [pq], ceratohyal [ch] Meckel's cartilage [mc], ethmoid plate [ep], hyosymplectic [hs]). (G') The height between Meckel's cartilage and ethmoid plate (indicated by vertical double-headed red arrow) and (H') the distance between Meckel's cartilage and ceratohyal (indicated by horizontal double-headed red arrow) were measured and analyzed in grhl3−/(Δ1-4) embryos and non-phenotypic siblings. Data are shown as mean ± SEM; n = 5. Statistical significance determined by Student's t-test ****p <.001. Scale bars: 100 μm (A-J'). |
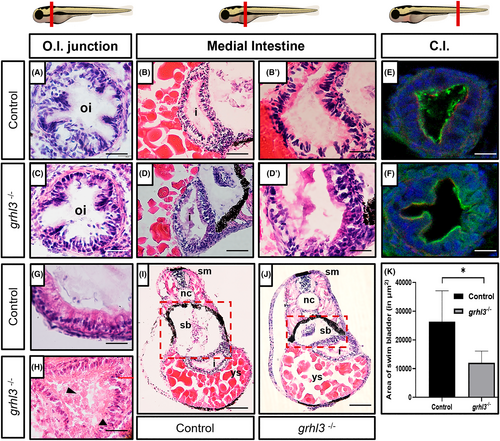
Intestinal epithelial and swim bladder morphology in grhl3−/−(−31) mutants. (A–D) Transverse-sections of 5 dpf intestine of control (A, B, B') and class 1 grhl3−/−(−31) (C, D, D') embryos highlighting the morphology of the intestinal region. (E, F) E-cadherin (green) and rhodamine phalloidin (red) expression in the intestinal lumen of control (E) and grhl3−/−(−31) (F) 5 dpf embryos. (G, H) Transverse-sections of 7 dpf intestine of control (G) and class 1 grhl3−/− mutants (H); black arrows show extensive red blood cell infiltration into the intestinal lumen. (I, J) Swim bladder morphology and size in grhl3−/− mutants and non-phenotypic siblings. (K) Area of swim bladder in grhl3−/− embryos and non-phenotypic siblings. Data represented as mean ± SEM; n = 3. Statistical significance determined by Student's t-test *p <.05. Scale bars: 20 μm (A, C, B', D', G, H), 50 μm (B, D, E, F) and 100 μm (I, J). Esophageal-Intestinal Junction [oi]; Caudal Intestine [C.I.]; Swim bladder [sb]; intestine[i]; yolk sac [ys]; notochord [nc]; somatic muscle [sm]. |