
|
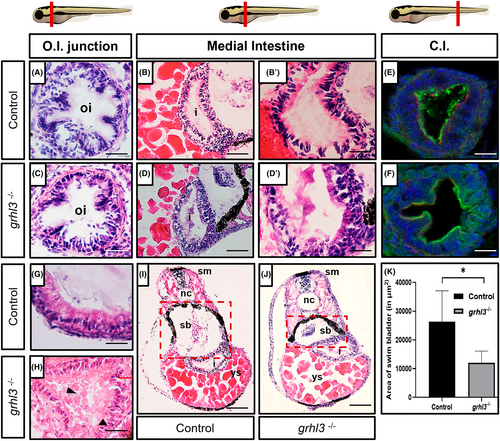
Fig. 7 Intestinal epithelial and swim bladder morphology in grhl3−/−(−31) mutants. (A–D) Transverse-sections of 5 dpf intestine of control (A, B, B') and class 1 grhl3−/−(−31) (C, D, D') embryos highlighting the morphology of the intestinal region. (E, F) E-cadherin (green) and rhodamine phalloidin (red) expression in the intestinal lumen of control (E) and grhl3−/−(−31) (F) 5 dpf embryos. (G, H) Transverse-sections of 7 dpf intestine of control (G) and class 1 grhl3−/− mutants (H); black arrows show extensive red blood cell infiltration into the intestinal lumen. (I, J) Swim bladder morphology and size in grhl3−/− mutants and non-phenotypic siblings. (K) Area of swim bladder in grhl3−/− embryos and non-phenotypic siblings. Data represented as mean ± SEM; n = 3. Statistical significance determined by Student's t-test *p <.05. Scale bars: 20 μm (A, C, B', D', G, H), 50 μm (B, D, E, F) and 100 μm (I, J). Esophageal-Intestinal Junction [oi]; Caudal Intestine [C.I.]; Swim bladder [sb]; intestine[i]; yolk sac [ys]; notochord [nc]; somatic muscle [sm].