
Image
|
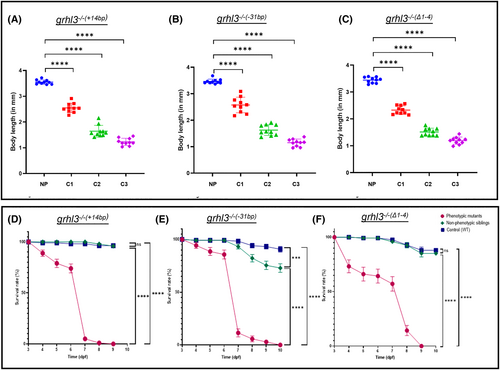
Figure Caption
Fig. 3 Maximum body length and survival age quantitation of grhl3−/− embryos. (A–C) Quantitation of body length of class 1, class 2, and class 3 grhl3−/−(+14 bp), grhl3−/−(−31bp), and grhl3−/−(Δ1-4) embryos. Data are represented as mean ± SEM; n = 10. (D–F) Maximum survival age of grhl3−/−(+14bp), grhl3−/−(−31 bp), and grhl3−/−(Δ1-4) embryos. ***p <.005; ****p <.001; ns, non-significant. Statistical significance determined by Student's t-tests.
Acknowledgments
This image is the copyrighted work of the attributed author or publisher, and
ZFIN has permission only to display this image to its users.
Additional permissions should be obtained from the applicable author or publisher of the image.
Full text @ Dev. Dyn.