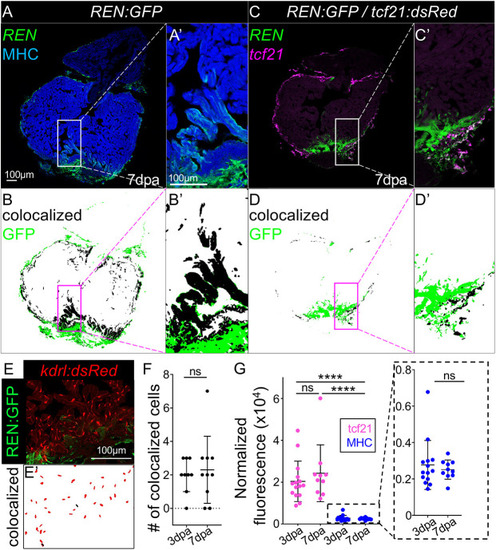
The REN enhancer expresses in epicardium and myocardium preceding the peak of regeneration. (A) Myocardial expression of REN:GFP is shown by staining with α-MHC (blue) in hearts at 7 dpa. (B) MIPAR rendition of colocalized regions in A (black) and excess GFP (green). (C) Epicardial expression of REN:GFP is shown by colocalization with a tcf21:red (pink) reporter in hearts at 7 dpa. (D) MIPAR rendition of colocalized regions in C. A′-D′ show magnification of boxed areas in A-D, respectively. (E) Endocardial expression of REN:GFP is shown by colocalization with a kdrl:red reporter in hearts at 7 dpa. (E′) MIPAR rendition of kdrl colocalization from E (black) and kdrl-positive cells that are GFP-negative (red). (F) Graph showing numbers of kdrl/GFP double-positive cells. (G) Graph showing the normalized GFP fluorescence of REN:GFP colocalized with tcf21:Red (pink) or muscle (blue). Data are mean±s.e.m. ****P<0.0001 (Mann-Whitney). ns, not significant.
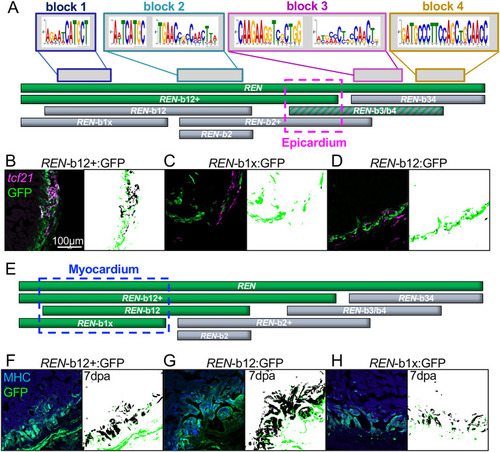
Myocardial REN-directed gene expression is separable from other cell types. (A) Schematic of full-length REN (top green bar) and the seven smaller REN fragments used in transgenic reporters. (B-D) GFP-positive fragments in epicardium (green) and GFP-negative (black). The epicardial-specific region is outlined in a pink dashed box in A. Left panels in B-D show hearts from the one positive REN-b12+ transgenic (B) and the two negative REN-b12 (C) and REN-b1x (D) reporters. Right panels show MIPAR renditions of colocalized areas (black) with excess GFP (green). (E) Same schematic as in A except REN fragments colored green are based on expression in muscle (α-MHC specific). (F-H) Left panels show hearts from the three positive reporter lines REN-b12+ (F), REN-b12 (G) and REN-b1x (H). Right panels show MIPAR renditions of colocalized areas (black) with excess GFP (green).
Deletion of REN increases cardiomyocyte proliferation during regeneration. (A) Top: images of sectioned amputated ventricles (7 dpa) from wild-type and ΔREN mutant fish. Sections are stained for Mef2c (green) and EdU (red). Bottom: double-positive cells are highlighted in black using a MIPAR software rendition. Scale bar: 100 µm. (B) Quantification of CM proliferation indices (Mef2+EdU+ cells/total Mef2+ cells) in 7 dpa ventricles. Wild type (Wt), dark blue; mutant, light blue. (C) Scatterplot of RNA-seq results comparing wild-type (x-axis) and ΔREN mutant (y-axis) samples. Each dot represents a transcript and is plotted by the log2 for the ratio of normalized reads from regeneration/normalized reads from the uninjured samples. Red dots are those transcripts that deviate by a linear regression >3-fold and blue dots are those transcripts that deviate by linear regression <−3-fold. Transcripts that are highlighted in the text are additionally marked in black circles. Green, pro-regeneration/proliferation genes; pink, sarcomeric genes; runx1-coregulatory factor cbfb, dark red. (D) Venn diagram comparing chromatin marks at the promoters of genes for which mRNA either increases (left) or decreases (right) in ΔREN mutant hearts during regeneration. (E) ddPCR shows the abundance of runx1 transcripts increasing from uninjured wild-type hearts (dark blue) during heart regeneration (red). In ΔREN mutant fish (light blue, pink), runx1 levels increase less so. The y-axis is the calculated runx1 mRNA numbers normalized to calculated number of mob4 mRNA. (F) Images of sectioned amputated ventricles (3 dpa) from wild-type and ΔREN mutant fish. Sections are stained by RNAscope using a probe for runx1 (green) and muscle was immunostained with an antibody towards myosin heavy chain (MHC; blue). Boxes 1-6 show a magnification of boxed regions around the wounds highlighting runx1 mRNA within the muscle (yellow arrows), epicardial cells (pink arrows) and likely endocardial cells adjacent to muscle that remains in the mutant (white arrowheads). (G) The number of runx1 mRNA foci from images such as F were counted using MIPAR. Quantification of foci that colocalized with muscle (MHC) is shown on the left. Quantification of foci that are not muscle is shown on the right. (H) There is little to no basal expression of runx1 in muscle around uninjured cardiac valves. Data are mean±s.e.m. **P<0.01, ****P<0.0001 (Welch's t-test). ns, not significant.
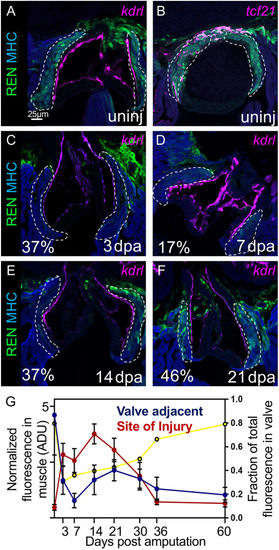
REN regulates gene expression in cardiac tissue surrounding valves in uninjured hearts. (A) Valves around the outflow tract in uninjured hearts are shown by endocardial reporter flk:Red (pink). REN:GFP is shown in green and muscle is stained with MHC (blue). (B) Both cardiac muscle (MHC, blue) and epicardium (tcf21 reporter, pink) colocalize with REN:GFP (green) around uninjured valves. (C-F) Same staining as in A, but this time on regenerating hearts at 3 dpa (C), 7 dpa (D), 14 dpa (E), and 21 dpa (F). Percentage of remaining GFP intensity is shown in the bottom left corner. (G) Mean GFP intensity in regions colocalizing with muscle (α-MHC). Cardiac valve regions are shown in blue, and site of injury is shown in red. The x-axis is a timeline for the days after amputation of the ventricle apex. The y-axis (left) is the normalized fluorescence and the y-axis (right) is the fraction of the total fluorescence that is found around valves (yellow line). The regions expected to be REN:GFP-positive in A-F are outlined with a white dashed line. However, quantitation was carried out for the entire muscle positive region. Data are mean±s.e.m.
REN regulates different genes in uninjured hearts and during regeneration. (A) Images of uninjured valves from wild-type and ΔREN mutant fish. Sections are stained by RNAscope using a probe for adamts1 (green) and muscle was immuno-stained with an antibody towards myosin heavy chain (MHC, blue). Yellow arrows, likely epicardial signal; blue arrows, CM signal; white dashed lines, REN expression domain; red dotted lines, canal to OFT; white asterisks, signal from endocardial interstitial cells that compromise the valve itself. (B) The number of adamts1 mRNA foci from images like A were counted using MIPAR. Quantification of foci that colocalized with muscle (MHC) is shown on the left. Quantification of foci that are not muscle is shown on the right. Wild type, dark blue; mutant, light blue. (C) The number of adamts1 mRNA foci from the sectioned amputated ventricles (3 dpa) analyzed for runx1 in Fig. 3F. Quantification of foci that colocalized with muscle is shown on the left. Quantification of foci that are not muscle is shown on the right. (D,E) AFOG staining of uninjured wild-type and uninjured ΔREN mutant hearts (D) and uninjured wild-type and uninjured ΔREN/Δrunx1 double heterozygote hearts (E). Valve leaflets are shown on the right in a magnification of boxed areas. (F) Valves around the outflow tract in uninjured wild-type and ΔREN mutant hearts are immunostained with anti-Collagen I (green) and anti-Mef2c (red) to mark CM nuclei. (G) Quantification of Collagen I stain intensity. Data are mean±s.e.m. **P=0.01 (Mann Whitney). ns, not significant.
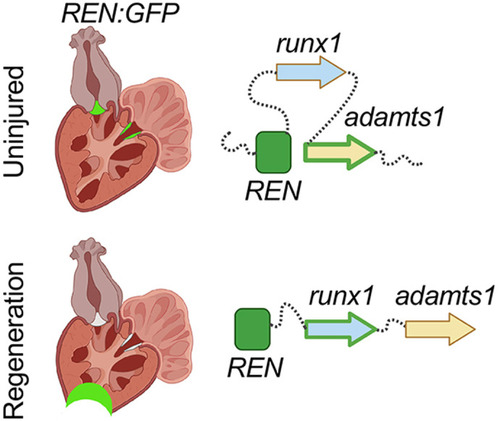
REN is rewired from a one cardiac domain to a different gene pathway during heart regeneration. Top: in uninjured hearts, REN activates expression of adamts1 around cardiac valves. Bottom: during regeneration REN is silenced around valves and is stimulated at the site of injury where it activates runx1.
Acknowledgments
This image is the copyrighted work of the attributed author or publisher, and
ZFIN has permission only to display this image to its users.
Additional permissions should be obtained from the applicable author or publisher of the image.
Full text @ Development
Your Input Welcome
Thank you for submitting comments. Your input has been emailed to ZFIN curators who may contact you if
additional information is required.
Oops. Something went wrong. Please try again later.