|
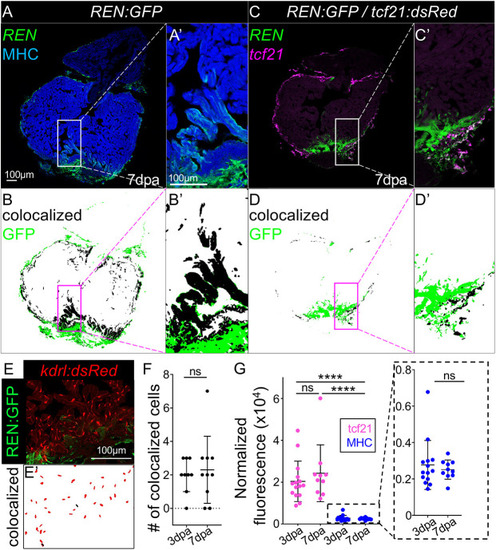
The REN enhancer expresses in epicardium and myocardium preceding the peak of regeneration. (A) Myocardial expression of REN:GFP is shown by staining with α-MHC (blue) in hearts at 7 dpa. (B) MIPAR rendition of colocalized regions in A (black) and excess GFP (green). (C) Epicardial expression of REN:GFP is shown by colocalization with a tcf21:red (pink) reporter in hearts at 7 dpa. (D) MIPAR rendition of colocalized regions in C. A′-D′ show magnification of boxed areas in A-D, respectively. (E) Endocardial expression of REN:GFP is shown by colocalization with a kdrl:red reporter in hearts at 7 dpa. (E′) MIPAR rendition of kdrl colocalization from E (black) and kdrl-positive cells that are GFP-negative (red). (F) Graph showing numbers of kdrl/GFP double-positive cells. (G) Graph showing the normalized GFP fluorescence of REN:GFP colocalized with tcf21:Red (pink) or muscle (blue). Data are mean±s.e.m. ****P<0.0001 (Mann-Whitney). ns, not significant.
|