
- Title
-
Cross-Shaped Heat Tensor Network for Morphometric Analysis Using Zebrafish Larvae Feature Keypoints
- Authors
- Chai, X., Sun, T., Li, Z., Zhang, Y., Sun, Q., Zhang, N., Qiu, J., Chai, X.
- Source
- Full text @ Sensors (Basel)
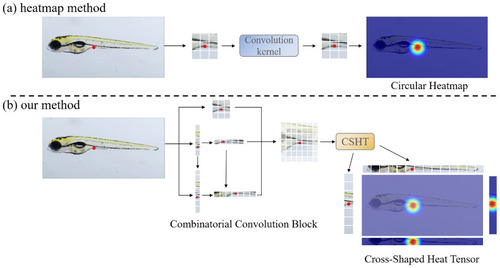
Comparison of the conventional keypoint detection framework and ours. ( |
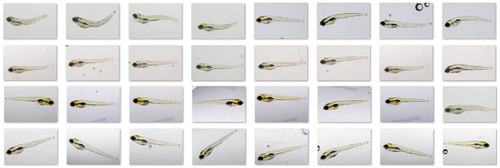
Examples of zebrafish larvae in our zebrafish dataset. |
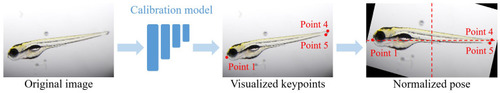
The process of zebrafish larvae image pose normalization. |
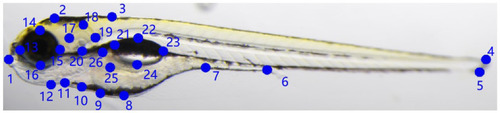
Visualized annotation example of zebrafish dataset with 26 feature points. |
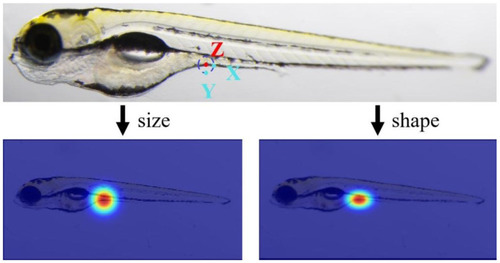
An example of keypoint prediction. Two predicted points, X and Y, for the GT point Z. The difference in human eye acceptance between two equidistant prediction points, X and Y, indicates that the heatmap’s size and shape influence the network’s performance. |
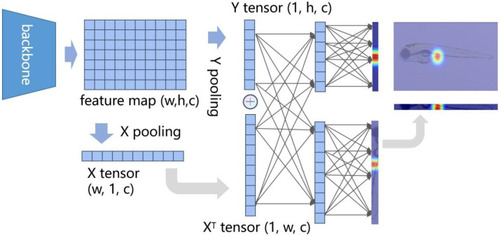
The structure of the cross-shaped heat tensor. |
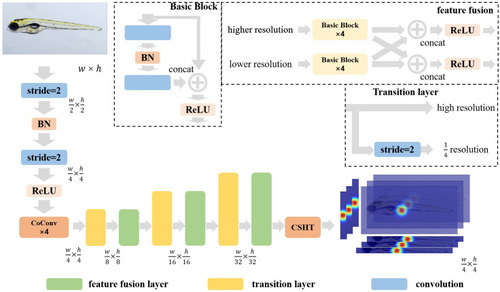
The architecture of our cross-shaped heat tensor network. |
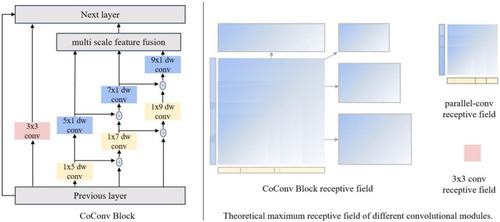
The structure of our CoConv-Block. It has a multi-scale branch, where a large branch can obtain input from both the previous layer and a small branch. Therefore, the receptive field of our CoConv-Block is much bigger than the original 3 × 3 convolution block and blocks that only parallel multi-scale convolution kernels. |
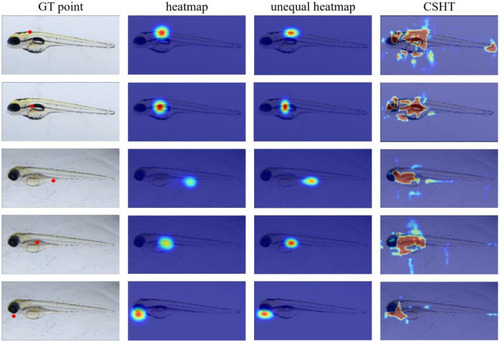
Visualized results of feature map generated by different pre-processing GT methods. Each row in the figure represents the output feature map of the same feature point. The first column displays the position of the ground truth of the feature point on the image. The second to fourth columns show the feature map from the model utilizing the heatmap, unequal heatmap, and our proposed CSHT technique. The attention in heatmap-based methods is confined to the area near keypoints, whereas with our method, the model’s attention expands to different parts of the zebrafish body. This proves that our method can free the model from the heatmap’s limitation on long-range feature extraction. |
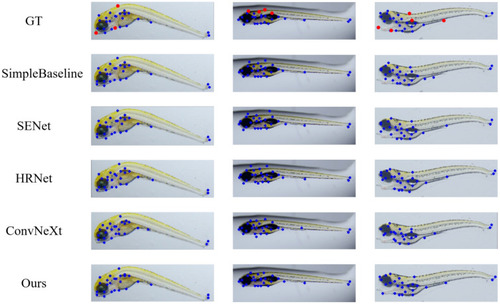
Visualized results of zebrafish larvae keypoint detection. From top to bottom, the corresponding feature point detection results are generated from ground truth, simpleBaseline, SENet, HRNet, ConvNeXt, and our network, respectively. The feature keypoints are marked with blue dots. The difficult-to-locate points typically found on the zebrafish larvae body contour are highlighted in red in GT. |