
Figure 9
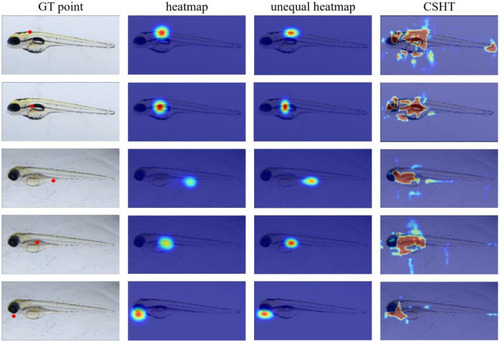
Visualized results of feature map generated by different pre-processing GT methods. Each row in the figure represents the output feature map of the same feature point. The first column displays the position of the ground truth of the feature point on the image. The second to fourth columns show the feature map from the model utilizing the heatmap, unequal heatmap, and our proposed CSHT technique. The attention in heatmap-based methods is confined to the area near keypoints, whereas with our method, the model’s attention expands to different parts of the zebrafish body. This proves that our method can free the model from the heatmap’s limitation on long-range feature extraction. |