
Image
|
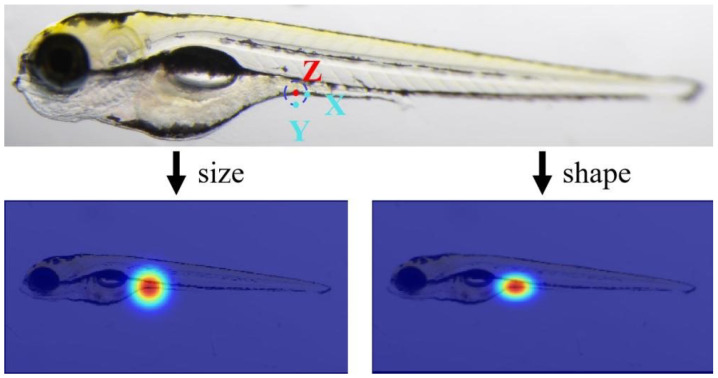
Figure Caption
Figure 5
An example of keypoint prediction. Two predicted points, X and Y, for the GT point Z. The difference in human eye acceptance between two equidistant prediction points, X and Y, indicates that the heatmap’s size and shape influence the network’s performance.
Acknowledgments
This image is the copyrighted work of the attributed author or publisher, and
ZFIN has permission only to display this image to its users.
Additional permissions should be obtained from the applicable author or publisher of the image.
Full text @ Sensors (Basel)