
- Title
-
Exposure to Nanoplastics Cause Caudal Vein Plexus Damage and Hematopoietic Dysfunction by Oxidative Stress Response in Zebrafish (Danio rerio)
- Authors
- Chen, J., Lu, C., Xie, W., Cao, X., Zhang, J., Luo, J., Li, J.
- Source
- Full text @ Int. J. Nanomedicine
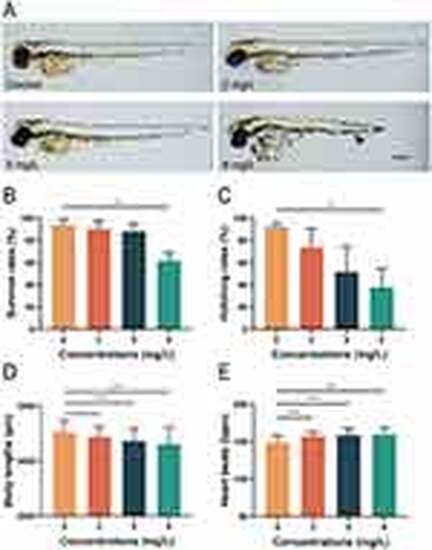
Toxicity of NPs on zebrafish embryonic development. (A) Morphological changes in zebrafish embryos exposed to varying NPs concentrations at 72 hpf. Black arrows indicate abnormal tail morphology. (B) Survival rates of zebrafish embryos treated with NPs at 72 hpf (n = 100). (C) Hatching rates of zebrafish embryos exposed to NPs· at 72 hpf (n = 100). (D) Body lengths of zebrafish embryos exposed to NPs at 72 hpf (n = 90). (E) Heart rates of zebrafish embryos treated with NPs at 48 hpf (n = 30). Data are presented as mean ± SD. Asterisks indicate statistical significance (*P < 0.05; **P < 0.01; ***P < 0.001). Scale bar = 100 μm. |
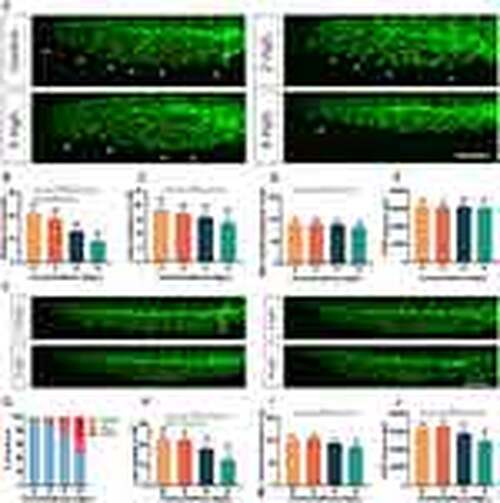
Exposure to NPs leads to developmental defects in the CVP of Tg(kdrl:eGFP) embryos. (A) Representative images of CVP developmental malformations in Tg(kdrl:eGFP) embryos treated with NPs at 30 hpf. (B-E) The numbers of filopodia (B), numbers of loop (C), maximum ventral extension distance (D) and area (E) of CVP in Tg(kdrl:eGFP) embryos after quantified NPs treatment at 30 hpf (n = 30 embryos). (F) Representative images of CVP developmental malformations in NPs-treated Tg(kdrl:eGFP) embryos at 48 hpf. (G) The malformation rate of CVP in Tg(kdrl:eGFP) embryos after quantified NPs treatment at 48 hpf (n = 30 embryos). (H-J) The numbers of loop (H), maximum ventral extension distance (I) and area (J) of CVP in Tg(kdrl:eGFP) embryos after quantified NPs treatment at 48 hpf (n = 30 embryos). White arrowheads, sprouts; red asterisks, loop structure; white vertical line, maximum ventral extension distance. Data are shown as mean ± SD. An asterisk above each bar indicates statistical significance (*P<0.05; **P<0.01; ***P<0.001). Scale bar, 100 μm. |
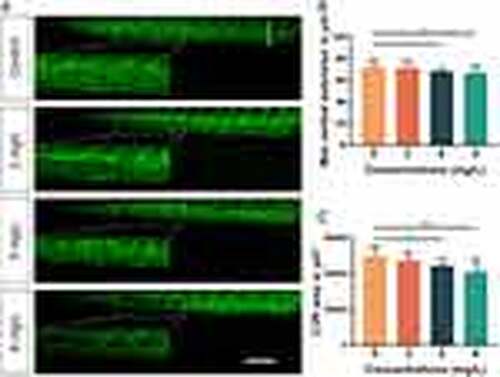
Exposure to NPs causes permanent defects in the CVP of Tg(kdrl:eGFP) embryos. (A) Representative image of permanent defects in the CVP of Tg(kdrl:eGFP) embryos due to exposure to NPs. (B, C) The maximum ventral extension distance (B) and area (C) of larval CVP after quantified NPs treatment (n=30 embryos). White line, maximum ventral extension distance. Data are shown as mean ± SD. An asterisk above each bar indicates statistical significance (*P<0.05; **P<0.01; ***P<0.001). Scale bar, 100 μm. |
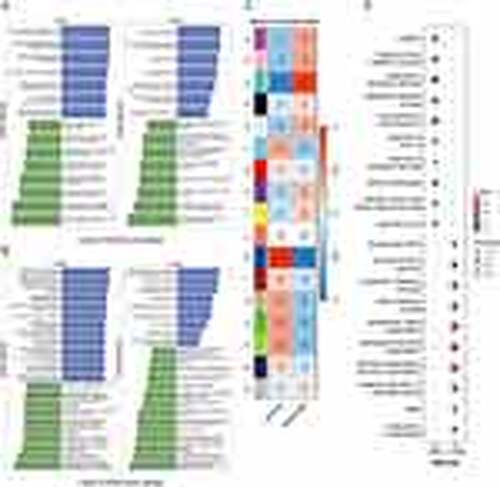
Alterations in the transcriptome of zebrafish embryos following NPs exposure. (A) Findings from the GSVA conducted on zebrafish embryos after exposure to a concentration of 5 mg/L of NPs (B) Results from the GSVA analysis performed on zebrafish embryos following exposure to 8 mg/L of NPs. (C) The WGCNA identified distinct gene modules (labeled a–q) in zebrafish embryos exposed to varying concentrations of NPs. (D) The screening conducted using WGCNA revealed GO enrichment analysis findings related to genes associated with CVP defects. |
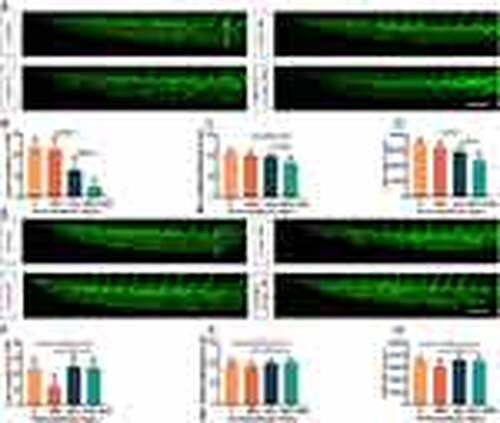
NPs cause oxidative stress damage to embryonic CVP development. (A) Representative images of developmental defects in CVP after treatment with low-doses of H2O2 and/or NPs for 46 h. (B-D) The loop numbers (B), maximum ventral extension distance (C) and area (D) of embryonic CVP after NPs and/or H2O2 treatment (n = 30 embryos). (E) Representative images of embryonic CVP development after treatment with NAC and/or NPs for 46 h. (F-H) The loop numbers (F), maximum ventral extension distance (G), and area (H) of CVP in embryos treated with NPs and/or NAC (n = 30 embryos). Red asterisks, loop structure; white line, maximum ventral extension distance. Data are shown as mean ± SD. An asterisk above each bar indicates statistical significance (***P<0.001; ns: not significant). Scale bar, 100 μm. |
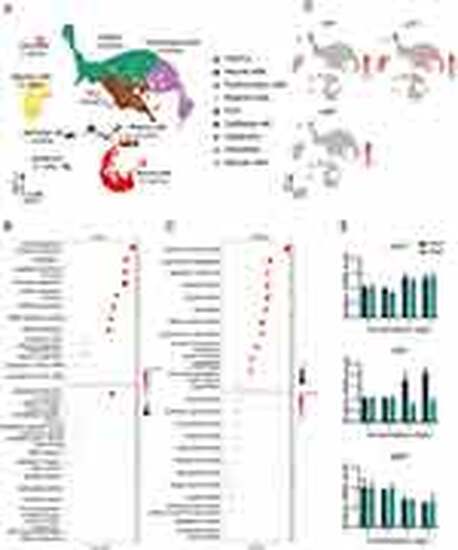
Identification of single cell subpopulation that influence the CVP damage and hematopoiesis after exposure to NPs. (A) UMAP visualization of single-cell data derived from zebrafish caudal fin tissue. (B and C) GO enrichment analysis findings of differentially expressed genes between HSPCs and ECs. (D) Gene expression analysis of angiogenic factors and redox-related genes in zebrafish tail tissue cells. (E)The mRNA levels of vascular endothelial growth factor and redox-related genes assessed post-NPs exposure. Data are shown as mean ± SD. An asterisk above each bar indicates statistical significance (*P<0.05; **P<0.01; ***P<0.001). |