
|
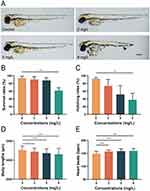
Fig. 1 Toxicity of NPs on zebrafish embryonic development. (A) Morphological changes in zebrafish embryos exposed to varying NPs concentrations at 72 hpf. Black arrows indicate abnormal tail morphology. (B) Survival rates of zebrafish embryos treated with NPs at 72 hpf (n = 100). (C) Hatching rates of zebrafish embryos exposed to NPs· at 72 hpf (n = 100). (D) Body lengths of zebrafish embryos exposed to NPs at 72 hpf (n = 90). (E) Heart rates of zebrafish embryos treated with NPs at 48 hpf (n = 30). Data are presented as mean ± SD. Asterisks indicate statistical significance (*P < 0.05; **P < 0.01; ***P < 0.001). Scale bar = 100 μm.