
|
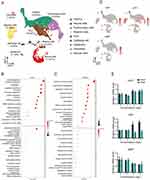
Fig. 6 Identification of single cell subpopulation that influence the CVP damage and hematopoiesis after exposure to NPs. (A) UMAP visualization of single-cell data derived from zebrafish caudal fin tissue. (B and C) GO enrichment analysis findings of differentially expressed genes between HSPCs and ECs. (D) Gene expression analysis of angiogenic factors and redox-related genes in zebrafish tail tissue cells. (E)The mRNA levels of vascular endothelial growth factor and redox-related genes assessed post-NPs exposure. Data are shown as mean ± SD. An asterisk above each bar indicates statistical significance (*P<0.05; **P<0.01; ***P<0.001).