
- Title
-
An mRNA vaccine induces antimycobacterial immunity by activating DNA damage repair and autophagy
- Authors
- Chen, D., Huang, W., Shen, L., Zhang, J., Pan, Z., Zhang, C., Tang, Y., Zhou, Z., Tao, J., Luo, G., Zhang, S., Zhou, J., Xu, S., Zhang, M., Li, Y., Fang, Y., Zhao, F., Huang, L., Li, H., Yang, H., Lv, H., Sha, W., Yan, B., Liu, J., Zhang, L.
- Source
- Full text @ Mol Ther Nucleic Acids
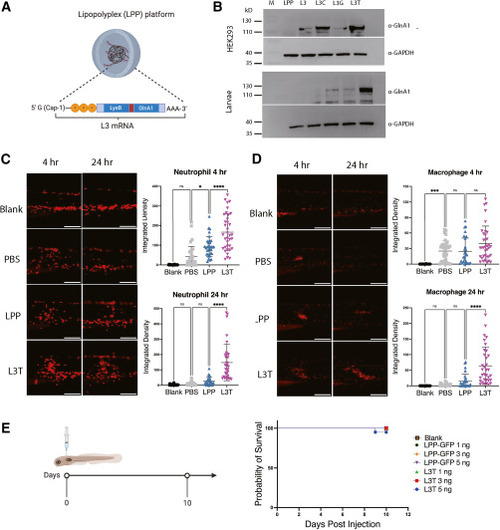
Construction and characterization of L3T mRNA vaccine (A) Scheme of the LPP-L3 mRNA design. (B) L3 protein expression in vitro (HEK293T cells) and in vivo (zebrafish larvae) at 24 hpost-transfection or post-injection of mRNA. (C and D) Neutrophil and macrophage recruitment at 4 and 24 h post-injection of 3 ng L3T mRNA (n ≥ 30). Blank: larvae without injection. PBS, LPP: larvae injected with PBS or LPP-GFP. Statistical analysis was performed using one-way ANOVA. ∗p < 0.05; ∗∗∗p < 0.001; ∗∗∗∗p < 0.0001. (E) L3T mRNA safety profile in larvae (n = 20). Blank: larvae without injection. |
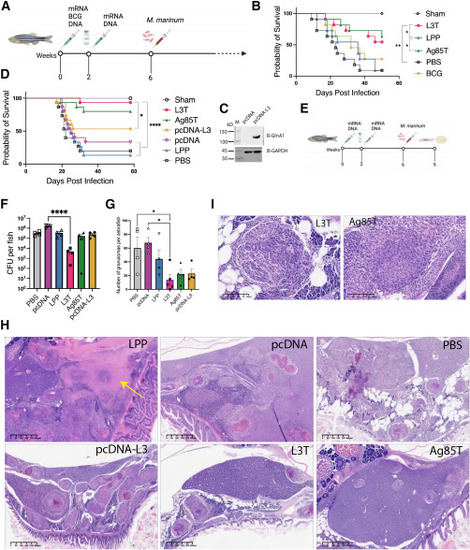
L3T mRNA vaccine protects zebrafish against M. marinum infection (A and E) Schemes of vaccine immunization and M. marinum infection. (B and D) Survival curves of adult zebrafish (n = 11–15) injected i.m. with mRNA or DNA twice with a 2-week interval, or BCG one time, followed by intraperitoneal injection of 500 CFU of M. marinum 535. Zebrafish injected with PBS or LPP or pcDNA were used as negative controls. Statistical analysis was performed using the log rank (Mantel-Cox) test. ∗p < 0.05; ∗∗p < 0.01; ∗∗∗∗p < 0.0001. (C) pcDNA-L3 expression in HEK293 T cells at 24 h transfection. (F and G) Bacterial burden (F) or number of granulomas (G) in zebrafish 3 weeks after M. marinum infection (n = 4 or 5). One-way ANOVA was performed for statistical analysis. ∗p < 0.05; ∗∗∗∗p < 0.0001. (H and I) Representative H&E staining of zebrafish tissues 3 weeks after M. marinum infection. Arrow in (H) indicates the caseous granulomas. |
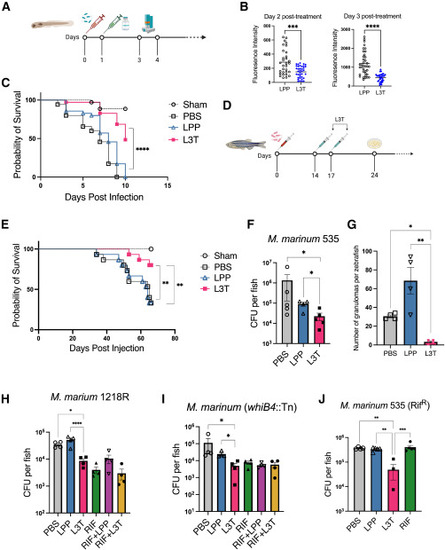
L3T mRNA vaccine exhibits potent therapeutic activity (A) Scheme of M. marinum infection and L3T mRNA treatment in larvae. (B) Bacterial burden was determined at days 2 and 3 post-L3T treatment (n = 35). Mann-Whitney tests were performed for statistical analysis. ∗∗∗p < 0.001; ∗∗∗∗p < 0.0001. (C) Survival curves of larvae were plotted (n = 35). Log rank test was performed for statistical analysis. ∗∗∗∗p < 0.0001. (D) Scheme of M. marinum infection and L3T mRNA treatment in adult zebrafish. (E) Survival curves of adult zebrafish were plotted (n = 15). Log rank test was performed for statistical analysis. ∗∗p < 0.01. (F) Bacterial burden of adult zebrafish 1 week after the second L3T treatment (n = 5). (G) Number of granulomas determined by H&E analysis (n = 4). (H–J) Bacterial burden in zebrafish 24 days post-intraperitoneal M. marinum infection (n = 4). Zebrafish treated with rifampicin (400 μM, bath treatment, daily for 7 days starting on day 14 post-infection) was used as the positive control. Zebrafish treated with the combination of L3T and rifampicin were also included. One-way ANOVA was performed for statistical analysis. ∗p < 0.05; ∗∗p < 0.01; ∗∗∗p < 0.001; ∗∗∗∗p < 0.0001. |
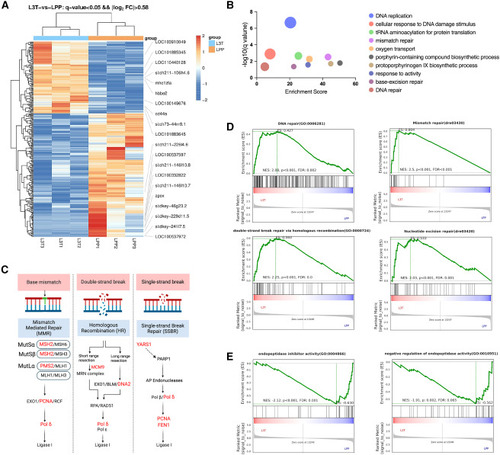
L3T mRNA vaccine induces DNA damage repair (A) Heatmap of differentially expressed genes (DEGs) of zebrafish immunized with L3T or the LPP control. (B) Enrichment of upregulated genes in the L3T immunized zebrafish by GO analysis. (C) DNA break repair pathways. Genes upregulated in the L3T immunized zebrafish were highlighted in red. (D and E) GSEA of the DEGs in L3T immunized groups compared with the control LPP group. |
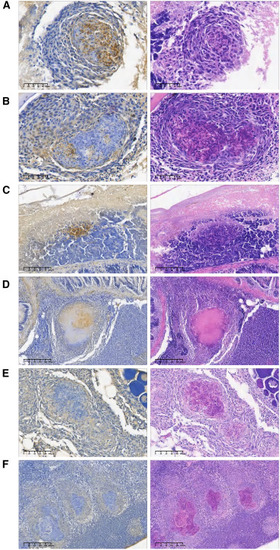
LC3B staining LC3B immunohistochemical and H&E staining of organs of the L3T group (A–D) and the control groups LPP (E) and PBS (F). |
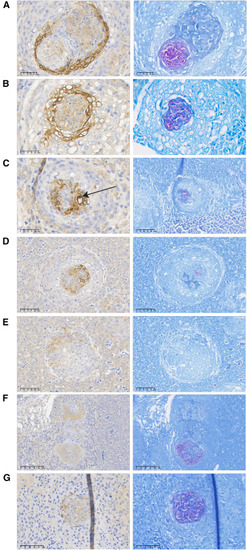
p62 staining p62 immunohistochemical and acid-fast staining of organs of the L3T group (A–E) and the control groups PBS (F) and LPP (G). The arrow in (C) indicates the strong p62 signal and the association with the large vacuole. |
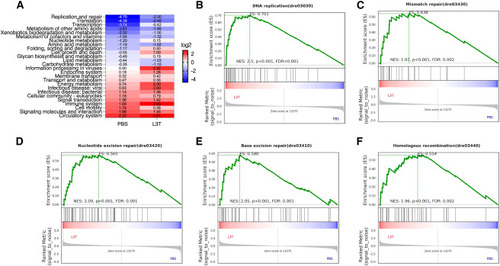
RNA-seq analysis of zebrafish infected with M. marinum 535 and treated with L3T mRNA (A) Significantly enriched KEGG pathways and the log2 ratio of the number of upregulated genes/the number of downregulated genes in each pathway. PBS, compared zebrafish at 24 days post-infection with those at 14 days post-infection; L3T, compared L3T treatment group at 24 days post-infection with those at 14 days post-infection (see Figure 3D). (B–F) GSEA of the DEGs in the L3T treatment group compared with the control PBS group. |