
|
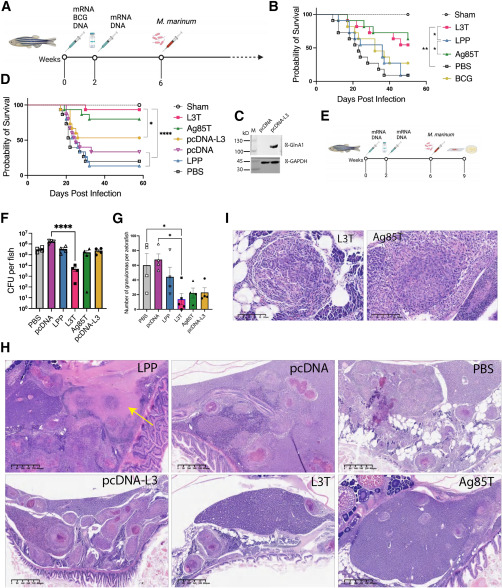
Fig. 2 L3T mRNA vaccine protects zebrafish against M. marinum infection (A and E) Schemes of vaccine immunization and M. marinum infection. (B and D) Survival curves of adult zebrafish (n = 11–15) injected i.m. with mRNA or DNA twice with a 2-week interval, or BCG one time, followed by intraperitoneal injection of 500 CFU of M. marinum 535. Zebrafish injected with PBS or LPP or pcDNA were used as negative controls. Statistical analysis was performed using the log rank (Mantel-Cox) test. ∗p < 0.05; ∗∗p < 0.01; ∗∗∗∗p < 0.0001. (C) pcDNA-L3 expression in HEK293 T cells at 24 h transfection. (F and G) Bacterial burden (F) or number of granulomas (G) in zebrafish 3 weeks after M. marinum infection (n = 4 or 5). One-way ANOVA was performed for statistical analysis. ∗p < 0.05; ∗∗∗∗p < 0.0001. (H and I) Representative H&E staining of zebrafish tissues 3 weeks after M. marinum infection. Arrow in (H) indicates the caseous granulomas.