
|
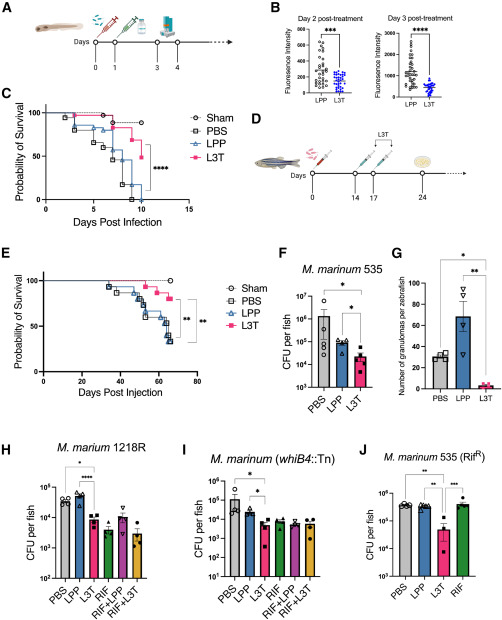
Fig. 3 L3T mRNA vaccine exhibits potent therapeutic activity (A) Scheme of M. marinum infection and L3T mRNA treatment in larvae. (B) Bacterial burden was determined at days 2 and 3 post-L3T treatment (n = 35). Mann-Whitney tests were performed for statistical analysis. ∗∗∗p < 0.001; ∗∗∗∗p < 0.0001. (C) Survival curves of larvae were plotted (n = 35). Log rank test was performed for statistical analysis. ∗∗∗∗p < 0.0001. (D) Scheme of M. marinum infection and L3T mRNA treatment in adult zebrafish. (E) Survival curves of adult zebrafish were plotted (n = 15). Log rank test was performed for statistical analysis. ∗∗p < 0.01. (F) Bacterial burden of adult zebrafish 1 week after the second L3T treatment (n = 5). (G) Number of granulomas determined by H&E analysis (n = 4). (H–J) Bacterial burden in zebrafish 24 days post-intraperitoneal M. marinum infection (n = 4). Zebrafish treated with rifampicin (400 μM, bath treatment, daily for 7 days starting on day 14 post-infection) was used as the positive control. Zebrafish treated with the combination of L3T and rifampicin were also included. One-way ANOVA was performed for statistical analysis. ∗p < 0.05; ∗∗p < 0.01; ∗∗∗p < 0.001; ∗∗∗∗p < 0.0001.