
- Title
-
SINEUP RNA rescues molecular phenotypes associated with CHD8 suppression in Autism Spectrum Disorder model systems
- Authors
- Di Leva, F., Arnoldi, M., Santarelli, S., Massonot, M., Lemée, M.V., Bon, C., Pellegrini, M., Castellini, M.E., Zarantonello, G., Messina, A., Bozzi, Y., Bernier, R., Zucchelli, S., Casarosa, S., Dassi, E., Ronzitti, G., Golzio, C., Morandell, J., Gustincich, S., Espinoza, S., Biagioli, M.
- Source
- Full text @ Mol. Ther.
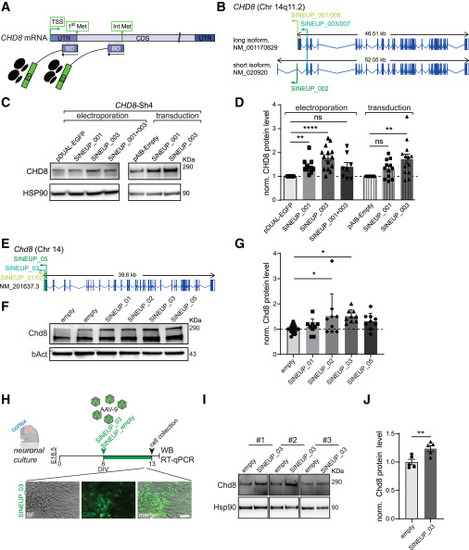
SINEUP-CHD8/Chd8 stimulates protein production in human hiNPCs and mouse primary neuronal cells (A) Schematic representation of SINEUP modular structure and its localization on CHD8 target transcript. BD, binding domain, overlapping in antisense orientation with the target mRNA; ED, effector domain, recruiting the target mRNA to polysomes to induce its translation. Two different SINEUP molecules have been designed which target either the translational initiation site (1st AUG, 1st Met) or one AUG in the CDS (int AUG). (B) Schematic representation of SINEUP-CHD8 (SINEUP_001/006, SINEUP_002, SINEUP_003/007) showing their location within CHD8 human isoforms, short GenBank: NM_020920 and long GenBank: NM_001170629, respectively. SINEUP_001 and _006 target the translational initiation site (1st AUG) of the long isoform, SINEUP_002 targets the 1st AUG of the short isoform, while SINEUP_003 and _007 recognize one in-frame AUG (Int AUG), which is common to both isoforms. (C) Representative western blots (WBs) for SINEUP_CHD8 delivery via electroporation or lentiviral transduction to a hiNPC CHD8 knockdown model obtained by Sh-driven CHD8 suppression (Sh4-CHD8) from Sugathan et al.14 Sh4-CHD8 cells were electroporated (left) or transduced (right) with lentiviral vectors expressing SINEUP control (pDUAL EGFP or pAIB-Empty) or the different SINEUP molecules targeting CHD8 (SINEUP_001, SINEUP_003, or the SINEUP_001 + 003 administered together). (D) Quantification of CHD8 protein levels from WB experiments (C) normalized on HSP90 and the respective control. HSP90 loading control—although smaller in size compared with CHD8 protein—carefully mirrors CHD8 protein levels in WB experiments, at high and low exposure, showing comparable correlation between the quantity of lysate and the chemiluminescence intensity with R2 coefficients above 0.95. (E) Schematic representation of SINEUP-Chd8 (SINEUP_01/02, SINEUP_03, and SINEUP_05) showing their target location within the Chd8 mouse ortholog (GenBank: NM_201637.3). (F) Representative WBs for SINUEP-Chd8 delivery via transfection to P19 cells. P19 cells were transfected with either SINEUP control vector (empty) or different SINEUPs targeting Chd8 (SINEUP_01, SINEUP_02, SINEUP_03, or SINEUP_05). (G) Quantification of Chd8 protein levels from WB experiments (F) normalized on β-actin and the empty control. (H) Primary cortical neuronal culture experimental setup from wild-type embryonic day 18.5 (E18.5) embryos (top) and representative images of neuronal cultures at 13 days in vitro (DIV) after AAV9 viral transduction with SINEUP_03 (bottom). (I) Western blots for SINEUP_03 delivery via viral transduction to primary cortical neurons. Primary neurons were transduced with SINEUP control vector (empty) or SINEUP_03 targeting Chd8. (J) Quantification of Chd8 protein levels from WB experiments, data normalized on Hsp90 (I). Data are presented as scatter dot blot, mean ± SEM with one-way ANOVA (parametric data) (G), or Kruskal-Wallis (non-parametric data) (D) significance testing followed by post-hoc tests for multiple testing correction; two-sided t-test in (J); significance levels: ∗∗∗∗p ≤ 0.0001, ∗∗∗p ≤ 0.001, ∗∗p ≤ 0.01, ∗p < 0.05; ns, not significant. Scale bar, 50 μm (H). |
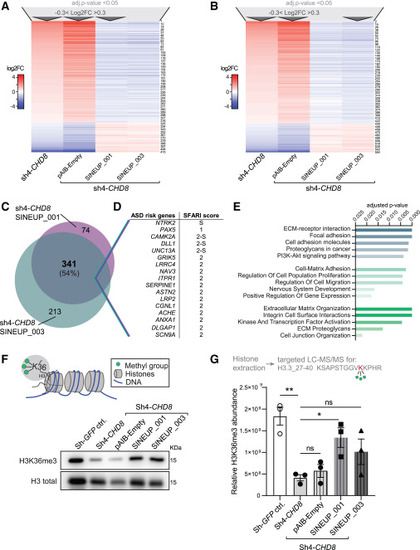
SINEUP-CHD8 molecules rescue cellular and molecular phenotypes associated with CHD8 suppression (A and B) Heatmaps of deregulated genes upon CHD8 knockdown in Sh4-CHD8 and Sh4-CHD8 hNPCs cells transduced with lentiviral particles expressing the pAIB-Empty control vector, rescued through SINEUP_001-mediated (A) and SINEUP_003-mediated (B) CHD8 protein translation induction (n = 4 replicates per condition, all DEGs first filtered for adjusted p value < 0.05 and −0.3 < log2FC > 0.3 as indicated by dark gray arrows, resulting in a total of N = 415 and N = 554 responding DEGs, respectively. (C) Area proportional Venn diagram demonstrating overlap of number of DEGs and percent of overlap between rescued transcripts (at padj < 0.05 and −0.3 < log2FC > 0.3) in Sh4-CHD8 knockdown cells. (D) Selection of ASD-risk genes found among the N = 341 shared DEGs responding to SINEUP_001 and SINEUP_003 expression in Sh4-CHD8 hiNPCs (C) and their SFARI gene score. (E) Selected terms from KEGG 2021 (teal, top), GO-term biological process 2023 (aquamarine, middle), and Reactome 2022 (green, bottom) gene list annotation as performed by the Enrichr tool54,55,56 on the N = 341 shared DEGs represented in (C). (F) CHD8 regulates H3K36 tri-methylation levels of cells chromatin (scheme, top), WB visualization of H3K36me3 levels in acidic Histone extracts upon hiNPC transduction (bottom). (G) Scheme of targeted LC-MS/MS approach to quantify H3K36me3 levels in histone extracts upon hiNPC transduction. A parallel reaction monitoring (PRM) method was established to target the trimethylated form of KSAPSTGGVKKPHR (H3.3_27–40) peptide. Skyline (version 24.1) was used to analyze and normalize peptide abundance changes (top). Relative abundance of H3K36me3 levels as obtained by targeted LC-MS/MS experiments (bottom) (n = 3 replicates per condition, data are presented as scatter dot blot ± SEM; one-way ANOVA followed by Sidak’s test for multiple testing correction, significance level ∗∗p ≤ 0.01, ∗p ≤ 0.05; ns, not significant). |
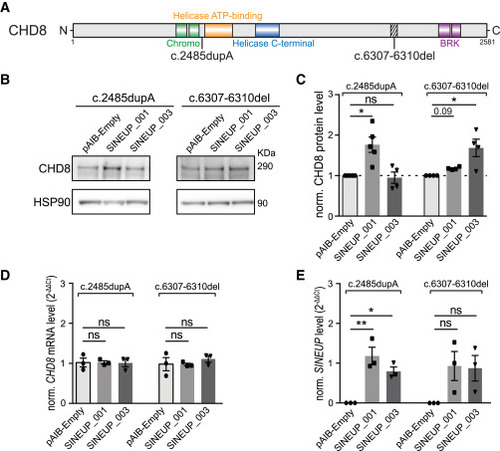
SINEUP-CHD8 stimulates protein production in patient-derived CHD8 fibroblasts (A) Schematic representation of the CHD8 variants present in the fibroblast cell lines used in this study. The main CHD8 domains are depicted as colored boxes along the CHD8 protein (CHROMO domains, DEXDc helicase domain, HELC-SANT domain, BRK domain). (B) Representative WBs on patient-derived fibroblasts harboring c.2485dup (left) and c.6307_6310del (right) mutations, transduced with SINEUP_001/003 or with the control vector (pAIB-Empty). (C) Bar graph representing fold change quantification of CHD8 protein level for WB experiments (B) normalized on HSP90. (D and E) Bar graph reporting RT-qPCR quantification of CHD8 transcript expression (D) or SINEUP expression (E) upon SINEUP-CHD8_001/003 or control vector transduction. NONO was used as a stable housekeeping gene for normalization. Data presented as mean normalized relative expression 2(–ΔΔCt) ± SEM. n(WB) = 4–5 replicates per condition, n(RT-qPCR) = 3 replicates per condition; data are presented as scatter dot blot ± SEM, Kruskal-Wallis (WB) and one-way ANOVA (RT-qPCR) followed by post hoc multiple testing correction, significance level ∗∗p ≤ 0.01, ∗p ≤ 0.05; ns, not significant. |
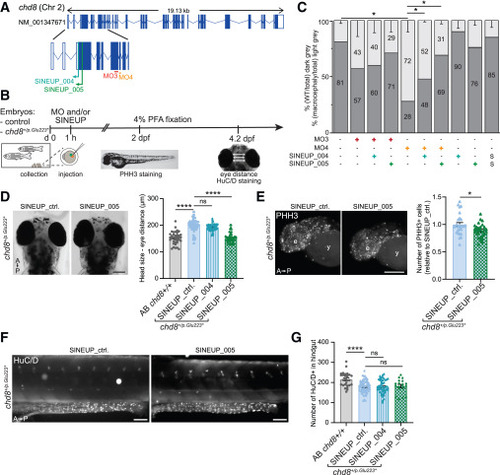
SINEUP-chd8 rescues chd8 suppression-driven macrocephaly in chd8 mutant zebrafish models (A) Schematic representation of chd8 SINEUP-chd8_004 and _005 showing their location within chd8 zebrafish isoform GenBank: NM_001347671 (top) and enlargement of the first 9 exons of chd8 in zebrafish with the localization of SINEUP-chd8_004/005 and the two morpholinos used (MO3 targeting exon 7, while MO4 targeting exon 8) (bottom). (B) Graphical representation of the experimental setup on zebrafish embryos. (C) Bar graph represents percentage of larvae showing macrocephaly (calculated as eye distance >12% in respect to wild type, light gray) or normocephaly (dark gray). Measurement of eye distance was performed both in wild-type Tü/Tü or AB/Tü strains of zebrafish larvae injected with 8 ng of chd8-MO3, 8 ng of chd8-MO4 with (+) or without (−) ∼200 pg of SINEUP-chd8_004 or _005; non-injected zebrafish larvae were used as control. Scramble (S) MO or SINEUP-chd8_004/005 alone were used as negative control (mean ± SEM are shown). Fisher-Yates exact test was performed. ∗p ≤ 0.05. n ≥ 25 embryos/condition. (D) Representative images of chd8p.Glu223∗ heterozygous zebrafish larvae head (4.2 dpf), dorsal views, injected with control or SINEUP-chd8 (left) and scatter dot blot reporting eye distance in wild-type (AB chd8+/+) or chd8p.Glu223∗-injected larvae (right). (E) Representative images of whole-mount PHH3 immunostaining on 2 dpf chd8p.Glu223∗ embryos injected with control or SINEUP-chd8_005 (left), and scatter dot plot showing the number of PHH3-positive cells in the head of 2 dpf chd8p.Glu223∗ heterozygous zebrafish embryos upon treatment (data were normalized to the number of PHH3-positive cells in the head of the 2 dpf wild-type (AB chd8+/+, right). (F) Representative lateral views of the hindgut area of chd8p.Glu223∗ zebrafish larvae (4.2 dpf) injected with control or SINEUP-chd8_004 or SINEUP-chd8_005 (left) and stained with anti-HuC/D, and scatter dot plot showing the number of HuC/D-positive cells in SINEUP_005- or SINEUP_004-injected larvae and control-injected larvae (right). Data are presented as scatter dot blot of mean ± SEM. One-way ANOVA was performed followed by Sidak’s post-hoc test for multiple testing correction (D and G); two-sided t test in (E); significance levels: ∗∗∗∗p < 0.0001, ∗p < 0.05; ns, not significant. Scale bars, 100 μm (D and F), 50 μm (E). A, anterior; P, posterior; e, eye; y, yolk. |