
Fig. 4
- ID
- ZDB-FIG-250408-22
- Publication
- Di Leva et al., 2024 - SINEUP RNA rescues molecular phenotypes associated with CHD8 suppression in Autism Spectrum Disorder model systems
- Other Figures
- All Figure Page
- Back to All Figure Page
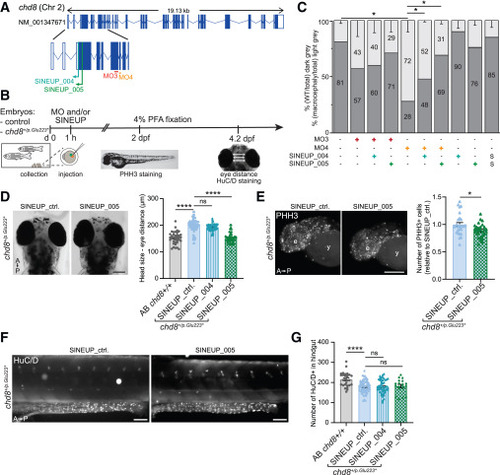
SINEUP-chd8 rescues chd8 suppression-driven macrocephaly in chd8 mutant zebrafish models (A) Schematic representation of chd8 SINEUP-chd8_004 and _005 showing their location within chd8 zebrafish isoform GenBank: NM_001347671 (top) and enlargement of the first 9 exons of chd8 in zebrafish with the localization of SINEUP-chd8_004/005 and the two morpholinos used (MO3 targeting exon 7, while MO4 targeting exon 8) (bottom). (B) Graphical representation of the experimental setup on zebrafish embryos. (C) Bar graph represents percentage of larvae showing macrocephaly (calculated as eye distance >12% in respect to wild type, light gray) or normocephaly (dark gray). Measurement of eye distance was performed both in wild-type Tü/Tü or AB/Tü strains of zebrafish larvae injected with 8 ng of chd8-MO3, 8 ng of chd8-MO4 with (+) or without (−) ∼200 pg of SINEUP-chd8_004 or _005; non-injected zebrafish larvae were used as control. Scramble (S) MO or SINEUP-chd8_004/005 alone were used as negative control (mean ± SEM are shown). Fisher-Yates exact test was performed. ∗p ≤ 0.05. n ≥ 25 embryos/condition. (D) Representative images of chd8p.Glu223∗ heterozygous zebrafish larvae head (4.2 dpf), dorsal views, injected with control or SINEUP-chd8 (left) and scatter dot blot reporting eye distance in wild-type (AB chd8+/+) or chd8p.Glu223∗-injected larvae (right). (E) Representative images of whole-mount PHH3 immunostaining on 2 dpf chd8p.Glu223∗ embryos injected with control or SINEUP-chd8_005 (left), and scatter dot plot showing the number of PHH3-positive cells in the head of 2 dpf chd8p.Glu223∗ heterozygous zebrafish embryos upon treatment (data were normalized to the number of PHH3-positive cells in the head of the 2 dpf wild-type (AB chd8+/+, right). (F) Representative lateral views of the hindgut area of chd8p.Glu223∗ zebrafish larvae (4.2 dpf) injected with control or SINEUP-chd8_004 or SINEUP-chd8_005 (left) and stained with anti-HuC/D, and scatter dot plot showing the number of HuC/D-positive cells in SINEUP_005- or SINEUP_004-injected larvae and control-injected larvae (right). Data are presented as scatter dot blot of mean ± SEM. One-way ANOVA was performed followed by Sidak’s post-hoc test for multiple testing correction (D and G); two-sided t test in (E); significance levels: ∗∗∗∗p < 0.0001, ∗p < 0.05; ns, not significant. Scale bars, 100 μm (D and F), 50 μm (E). A, anterior; P, posterior; e, eye; y, yolk. |