
Fig. 2
- ID
- ZDB-FIG-250408-20
- Publication
- Di Leva et al., 2024 - SINEUP RNA rescues molecular phenotypes associated with CHD8 suppression in Autism Spectrum Disorder model systems
- Other Figures
- All Figure Page
- Back to All Figure Page
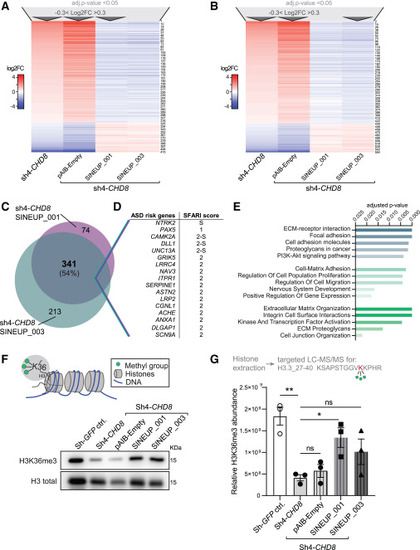
SINEUP-CHD8 molecules rescue cellular and molecular phenotypes associated with CHD8 suppression (A and B) Heatmaps of deregulated genes upon CHD8 knockdown in Sh4-CHD8 and Sh4-CHD8 hNPCs cells transduced with lentiviral particles expressing the pAIB-Empty control vector, rescued through SINEUP_001-mediated (A) and SINEUP_003-mediated (B) CHD8 protein translation induction (n = 4 replicates per condition, all DEGs first filtered for adjusted p value < 0.05 and −0.3 < log2FC > 0.3 as indicated by dark gray arrows, resulting in a total of N = 415 and N = 554 responding DEGs, respectively. (C) Area proportional Venn diagram demonstrating overlap of number of DEGs and percent of overlap between rescued transcripts (at padj < 0.05 and −0.3 < log2FC > 0.3) in Sh4-CHD8 knockdown cells. (D) Selection of ASD-risk genes found among the N = 341 shared DEGs responding to SINEUP_001 and SINEUP_003 expression in Sh4-CHD8 hiNPCs (C) and their SFARI gene score. (E) Selected terms from KEGG 2021 (teal, top), GO-term biological process 2023 (aquamarine, middle), and Reactome 2022 (green, bottom) gene list annotation as performed by the Enrichr tool54,55,56 on the N = 341 shared DEGs represented in (C). (F) CHD8 regulates H3K36 tri-methylation levels of cells chromatin (scheme, top), WB visualization of H3K36me3 levels in acidic Histone extracts upon hiNPC transduction (bottom). (G) Scheme of targeted LC-MS/MS approach to quantify H3K36me3 levels in histone extracts upon hiNPC transduction. A parallel reaction monitoring (PRM) method was established to target the trimethylated form of KSAPSTGGVKKPHR (H3.3_27–40) peptide. Skyline (version 24.1) was used to analyze and normalize peptide abundance changes (top). Relative abundance of H3K36me3 levels as obtained by targeted LC-MS/MS experiments (bottom) (n = 3 replicates per condition, data are presented as scatter dot blot ± SEM; one-way ANOVA followed by Sidak’s test for multiple testing correction, significance level ∗∗p ≤ 0.01, ∗p ≤ 0.05; ns, not significant). |