
|
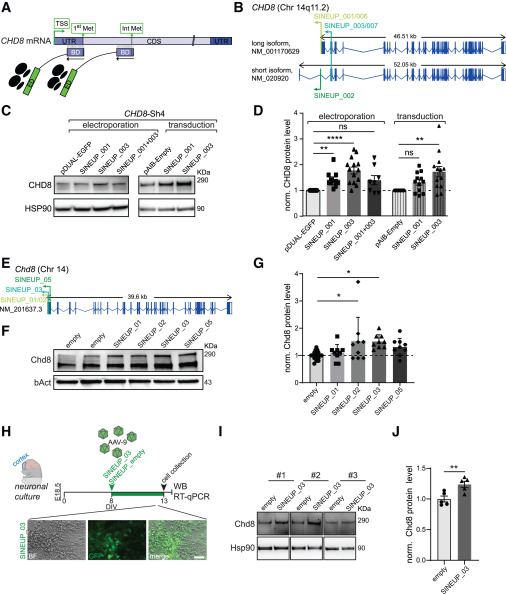
Fig. 1 SINEUP-CHD8/Chd8 stimulates protein production in human hiNPCs and mouse primary neuronal cells (A) Schematic representation of SINEUP modular structure and its localization on CHD8 target transcript. BD, binding domain, overlapping in antisense orientation with the target mRNA; ED, effector domain, recruiting the target mRNA to polysomes to induce its translation. Two different SINEUP molecules have been designed which target either the translational initiation site (1st AUG, 1st Met) or one AUG in the CDS (int AUG). (B) Schematic representation of SINEUP-CHD8 (SINEUP_001/006, SINEUP_002, SINEUP_003/007) showing their location within CHD8 human isoforms, short GenBank: NM_020920 and long GenBank: NM_001170629, respectively. SINEUP_001 and _006 target the translational initiation site (1st AUG) of the long isoform, SINEUP_002 targets the 1st AUG of the short isoform, while SINEUP_003 and _007 recognize one in-frame AUG (Int AUG), which is common to both isoforms. (C) Representative western blots (WBs) for SINEUP_CHD8 delivery via electroporation or lentiviral transduction to a hiNPC CHD8 knockdown model obtained by Sh-driven CHD8 suppression (Sh4-CHD8) from Sugathan et al.14 Sh4-CHD8 cells were electroporated (left) or transduced (right) with lentiviral vectors expressing SINEUP control (pDUAL EGFP or pAIB-Empty) or the different SINEUP molecules targeting CHD8 (SINEUP_001, SINEUP_003, or the SINEUP_001 + 003 administered together). (D) Quantification of CHD8 protein levels from WB experiments (C) normalized on HSP90 and the respective control. HSP90 loading control—although smaller in size compared with CHD8 protein—carefully mirrors CHD8 protein levels in WB experiments, at high and low exposure, showing comparable correlation between the quantity of lysate and the chemiluminescence intensity with R2 coefficients above 0.95. (E) Schematic representation of SINEUP-Chd8 (SINEUP_01/02, SINEUP_03, and SINEUP_05) showing their target location within the Chd8 mouse ortholog (GenBank: NM_201637.3). (F) Representative WBs for SINUEP-Chd8 delivery via transfection to P19 cells. P19 cells were transfected with either SINEUP control vector (empty) or different SINEUPs targeting Chd8 (SINEUP_01, SINEUP_02, SINEUP_03, or SINEUP_05). (G) Quantification of Chd8 protein levels from WB experiments (F) normalized on β-actin and the empty control. (H) Primary cortical neuronal culture experimental setup from wild-type embryonic day 18.5 (E18.5) embryos (top) and representative images of neuronal cultures at 13 days in vitro (DIV) after AAV9 viral transduction with SINEUP_03 (bottom). (I) Western blots for SINEUP_03 delivery via viral transduction to primary cortical neurons. Primary neurons were transduced with SINEUP control vector (empty) or SINEUP_03 targeting Chd8. (J) Quantification of Chd8 protein levels from WB experiments, data normalized on Hsp90 (I). Data are presented as scatter dot blot, mean ± SEM with one-way ANOVA (parametric data) (G), or Kruskal-Wallis (non-parametric data) (D) significance testing followed by post-hoc tests for multiple testing correction; two-sided t-test in (J); significance levels: ∗∗∗∗p ≤ 0.0001, ∗∗∗p ≤ 0.001, ∗∗p ≤ 0.01, ∗p < 0.05; ns, not significant. Scale bar, 50 μm (H).