
- Title
-
Actinomycetota From Macroalgae as Rich Source for Natural Products Discovery Revealed Through Culture-Dependent and -Independent Approaches
- Authors
- Girão, M., Rego, A., Fonseca, A.C., Cao, W., Jia, Z., Urbatzka, R., Leão, P.N., Carvalho, M.F.
- Source
- Full text @ Microb Biotechnol
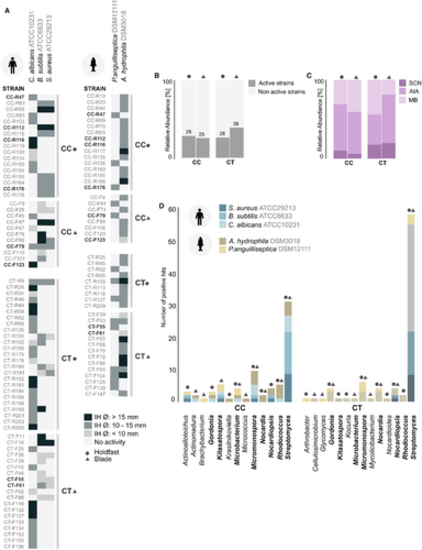
Antimicrobial screening of Actinomycetota isolated from C. crispus (CC) and C. tomentosum (CT). (A) Strains with bioactivity in the antimicrobial assay. Only strains active towards at least one reference microorganism are presented. Data displayed as average measurement (mm) of the inhibition halos (IH) diameter from two independent experiments. Strains highlighted in bold presented inhibitory effect towards the growth of at least one human and fish health-relevant reference microorganism. (B) Distribution of active and non-active strains retrieved from CC and CT. (C) Distribution of active strains according to their fermentation medium. (D) Genus-level taxonomic distribution of active strains. Taxonomic groups highlighted in bold were found in both macroalgae. The source of isolation, holdfast (●) or blade (▲), is indicated in all graphs. |
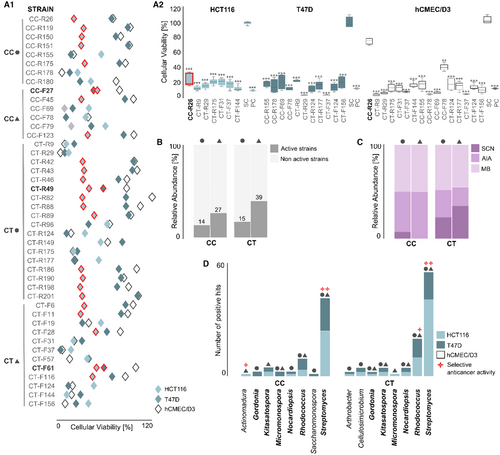
Anticancer screening of Actinomycetota isolated from C. crispus (CC) and C. tomentosum (CT). (A1) Strains with bioactivity in the MTT assay (15 μg/mL). Only the most active strains (p value < 0.001) are presented. Data displayed as mean of cellular viability (%) from two independent experiments (n = 6) and significant differences compared to the SC (solvent control: 0.5% DMSO), after 48 h of exposure. Results for the two cancer cell lines (HCT116 and T47D) and the non-cancer cell line (hCMEC/D3) are presented. Extracts with selective activity in cancer cells are red-bordered, with the ones highlighted in bold presenting cytotoxicity towards both cancer cell lines tested. (A2) Most active extracts in each cancer cell line compared to SC and PC (positive control: 15 μg mL−1 staurosporine). Extracts with selective activity in cancer cells are red-bordered. ***p value < 0.001. (B) Distribution of active and non-active strains retrieved from CC and CT. (C) Distribution of active strains according to their fermentation medium. (D) Genus-level taxonomic distribution of active strains. Taxonomic groups highlighted in bold were found in both macroalgae. The source of isolation, holdfast (●) or blade (▲), is indicated in all graphs. |

Antiobesity screening of Actinomycetota isolated from C. crispus (CC) and C. tomentosum (CT). (A1) Strains with bioactivity in the Nile Red fat metabolism assay. Data displayed as mean fluorescence intensity (MFI) relative to DMSO (dimethylsulfoxide 0.1%, solvent control) from two independent experiments (n = 6). Statistical differences are shown as asterisks, **p value < 0.01 and ***p value < 0.001. (A2) Representative images of zebrafish larvae (overlay of brightfield picture and red fluorescence channel), showing individuals exposed to DMSO, REV (positive control; 50 μM) and the crude extract of strain CC-F68. (B) Distribution of active and non-active strains retrieved from CC and CT. (C) Distribution of active strains according to their fermentation medium. (D) Genus-level taxonomic distribution of active strains. The source of isolation, holdfast (●) or blade (▲), is indicated. |
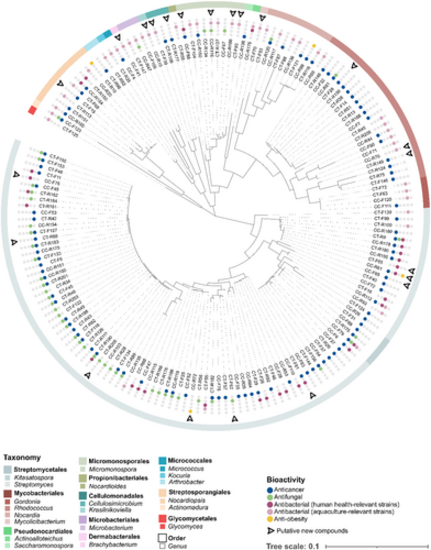
ML phylogenetic tree based on 16S rRNA gene sequences (1311 nt), showing the evolutionary relationship between all 165 bioactive strains. The results of the bioactivity screenings are provided for every strain. Strains encoding putative new compounds are indicated as well. |
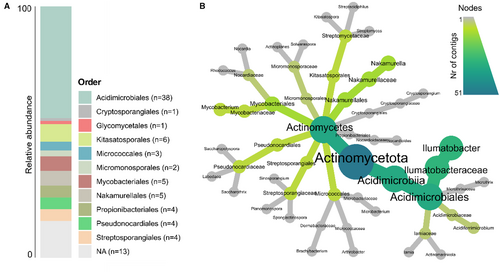
Taxonomic classification of actinobacterial contigs from which BGCs were identified through the antiSMASH analysis. (A) Taxonomic classification of actinobacterial contigs at order level. (B) Heat tree plot of taxonomic classification of contigs. Only contigs from which it was possible to obtain a taxonomic classification at genus level are depicted (n = 51). |
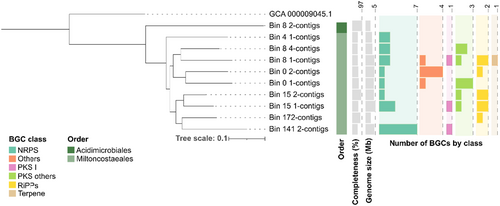
ML phylogenomic tree of the metagenome assembled genomes (MAGs) recovered in this study. Information of completeness (bar represented from 50.7% to 97%), total length (bar represented from 2.4 to 5.1 Mb) and the number of biosynthetic gene clusters (BGCs) by class for each MAG is included. Bacillus subtilis (GCF_000009045.1) was used as outgroup. |

Actinobacterial gene cluster families (GCFs) from C. crispus (CC) and C. tomentosum (CT). (A) Sequence similarity network (SSN) of all biosynthetic gene cluster (BGC) classes recovered from MIBiG. The different colours correspond to distinct GCFs identified by BiG-SCAPE. BGCs recovered from metagenome assembled genomes (MAGs) are represented by a rectangle, from contigs associated to CT sample by a triangle, from contigs associated to CC sample by a round rectangle and MIBiG BGCs are represented by a circle. (B) Total number of GCFs by BGC class. (C) Upset intersection plot for the GCFs by sample type (contigs CT sample, contigs CC sample, MAGs) and the GCFs for MIBiG BGCs. |