
|
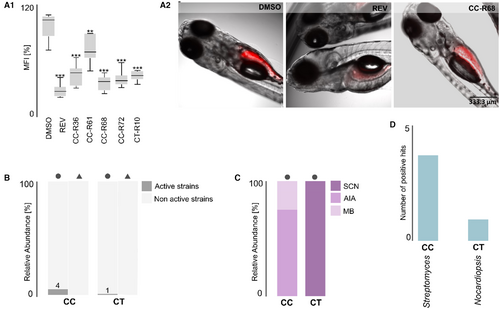
Fig. 3 Antiobesity screening of Actinomycetota isolated from C. crispus (CC) and C. tomentosum (CT). (A1) Strains with bioactivity in the Nile Red fat metabolism assay. Data displayed as mean fluorescence intensity (MFI) relative to DMSO (dimethylsulfoxide 0.1%, solvent control) from two independent experiments (n = 6). Statistical differences are shown as asterisks, **p value < 0.01 and ***p value < 0.001. (A2) Representative images of zebrafish larvae (overlay of brightfield picture and red fluorescence channel), showing individuals exposed to DMSO, REV (positive control; 50 μM) and the crude extract of strain CC-F68. (B) Distribution of active and non-active strains retrieved from CC and CT. (C) Distribution of active strains according to their fermentation medium. (D) Genus-level taxonomic distribution of active strains. The source of isolation, holdfast (●) or blade (▲), is indicated.