
|
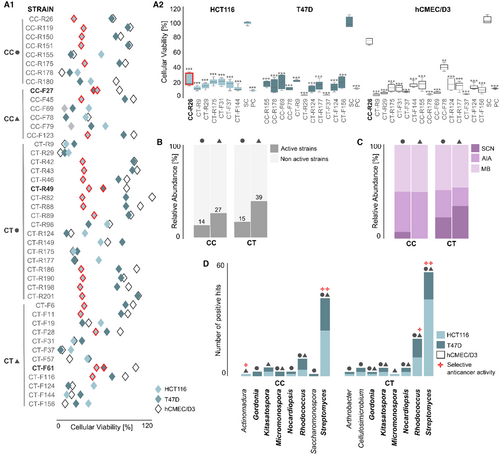
Fig. 2 Anticancer screening of Actinomycetota isolated from C. crispus (CC) and C. tomentosum (CT). (A1) Strains with bioactivity in the MTT assay (15 μg/mL). Only the most active strains (p value < 0.001) are presented. Data displayed as mean of cellular viability (%) from two independent experiments (n = 6) and significant differences compared to the SC (solvent control: 0.5% DMSO), after 48 h of exposure. Results for the two cancer cell lines (HCT116 and T47D) and the non-cancer cell line (hCMEC/D3) are presented. Extracts with selective activity in cancer cells are red-bordered, with the ones highlighted in bold presenting cytotoxicity towards both cancer cell lines tested. (A2) Most active extracts in each cancer cell line compared to SC and PC (positive control: 15 μg mL−1 staurosporine). Extracts with selective activity in cancer cells are red-bordered. ***p value < 0.001. (B) Distribution of active and non-active strains retrieved from CC and CT. (C) Distribution of active strains according to their fermentation medium. (D) Genus-level taxonomic distribution of active strains. Taxonomic groups highlighted in bold were found in both macroalgae. The source of isolation, holdfast (●) or blade (▲), is indicated in all graphs.