FIGURE SUMMARY
Title

Long-Term Yo-Yo Dieting Exaggerates Liver Steatosis and Lesions but Preserves Muscle Performance in Male Zebrafish

Authors
Hsu, T.C., Chiang, C.H., Liu, I.H., Wang, C.Y., Chen, C.Y.
Source
Full text @ Int. J. Mol. Sci.

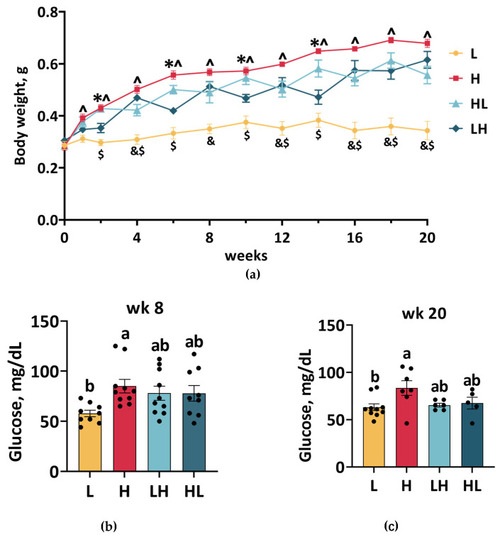
Body weight and blood glucose levels of male zebrafish. (a) Zebrafish were fed 7 times per day (H) to induce obesity or twice daily (L) to induce weight loss, and the feeding frequency was switched every two weeks to induce weight cycling. ^ (H vs. L), * (H vs. LH), & (L vs. LH), $ (L vs. HL), and p ≤ 0.05. Blood glucose levels at weeks 8 (b) and 20 (c) were analyzed. ab In the graphs, lines, and bars sharing different letters are significantly different (p ≤ 0.05). Data are presented as the mean ± SEM (n = 5–10).

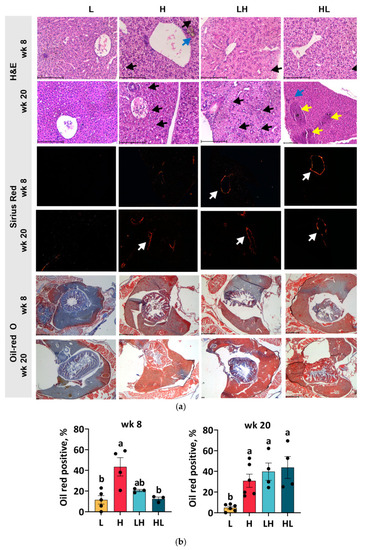
Liver histology. The liver sections were individually stained with H&E, Sirius red, and Oil Red O (a). The positive area of oil red-O staining at week 8 and week 20 was quantified (b). The scale bar for H&E and Sirius red is 100 µm, and that for Oil Red O is 500 µm. Black arrows indicate the ballooning hepatocytes; blue arrows indicate the cholestasis site; yellow arrows indicate hyperemia; and white arrows indicate fibrosis. ab In the graphs, lines, and bars sharing different letters are significantly different (p ≤ 0.05). Data are presented as the mean ± SEM (n = 3–6).

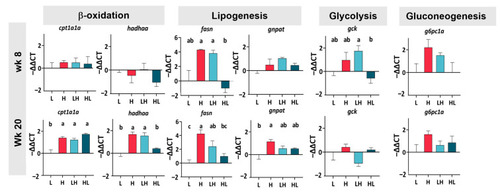
Gene expression in the liver. Data were analyzed by one-way ANOVA followed by Tukey’s test for multiple comparisons and are presented as the mean ± SEM (n = 3–7). abc In the graphs, lines and bars sharing different letters are significantly different (p ≤ 0.05). cpt1a1a: carnitine palmitoyltransferase 1Aa; hadhaa: hydroxy acyl-CoA dehydrogenase trifunctional multienzyme complex subunit alpha a; fasn: fatty acid synthase; gnpat: glycerophosphate O-acyltransferase; gck: glucokinase; g6pc1a: glucose-6-phosphatase catalytic subunit 1a.

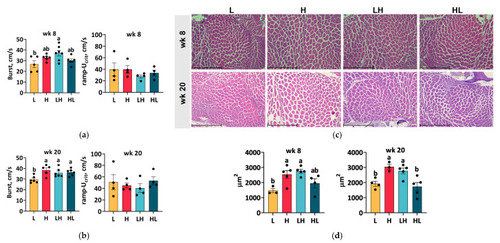
Swimming performance and muscle histology. The speeds of burst swimming and ramp-Ucrit swimming at week 8 (a) and week 20 (b) were determined. The speed of the burst swimming test was ramped up every minute, and the speed of ramp-Ucrit swimming was ramped up every ten minutes until the fish became fatigued. The cross-section of the tail muscle was stained with H&E (c), and the fiber size (d) at week 8 and week 20 was quantified. Scale bar = 500 µm. ab In the graphs, lines, and bars sharing different letters are significantly different (p ≤ 0.05). Data are presented as the mean ± SEM (n = 3–7).

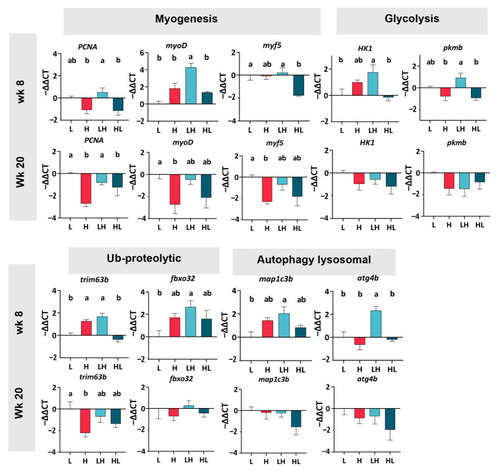
Gene expression in the muscle. Data were analyzed via one-way ANOVA followed by Tukey’s test for multiple comparisons and are presented as the mean ± SEM (n = 3–7). ab In the graphs, lines, and bars sharing different letters are significantly different (p ≤ 0.05). PCNA: Proliferating Cell Nuclear Antigen; myoD: Myoblast determination protein 1; myf5: Myogenic factor 5; HK1: hexokinase 1; pkmb: pyruvate kinase M1/2b; trim63b: E3 ubiquitin-protein ligase b; fbxo32: Atrogin1; map1c3b: tubule-associated protein 1 light chain 3 beta; atg4b: cysteine protease.

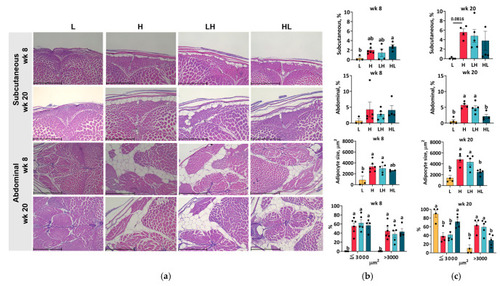
The histology and characteristics of adipose tissues. The sections of subcutaneous and abdominal adipose tissues were stained with H&E (a). Scale bar = 500 µm. The characteristics of adipose tissue, including fat percentages, average size, and distribution of abdominal adipocytes, were analyzed at week 8 (b) and week 20 (c). Data are presented as the mean ± SEM (n = 3–6). ab In the graphs, lines, and bars sharing different letters are significantly different (p ≤ 0.05).

Acknowledgments
This image is the copyrighted work of the attributed author or publisher, and ZFIN has permission only to display this image to its users. Additional permissions should be obtained from the applicable author or publisher of the image. Full text @ Int. J. Mol. Sci.