
Image
|
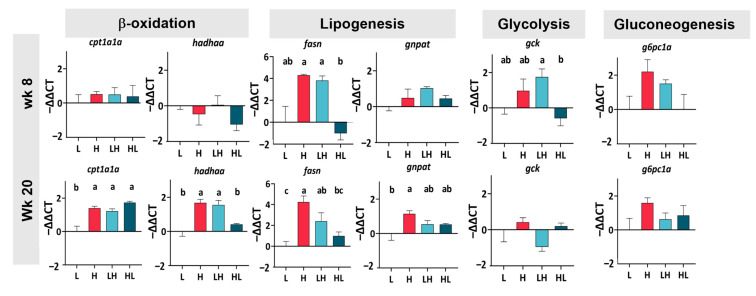
Figure Caption
Figure 3
Gene expression in the liver. Data were analyzed by one-way ANOVA followed by Tukey’s test for multiple comparisons and are presented as the mean ± SEM (
Acknowledgments
This image is the copyrighted work of the attributed author or publisher, and
ZFIN has permission only to display this image to its users.
Additional permissions should be obtained from the applicable author or publisher of the image.
Full text @ Int. J. Mol. Sci.