
- Title
-
A potent and selective anti-glutathione peroxidase 4 nanobody as a ferroptosis inducer
- Authors
- Li, X., Li, Y., Xie, A., Chen, F., Wang, J., Zhou, J., Xu, X., Xu, Z., Wang, Y., Qiu, X.
- Source
- Full text @ Chem Sci
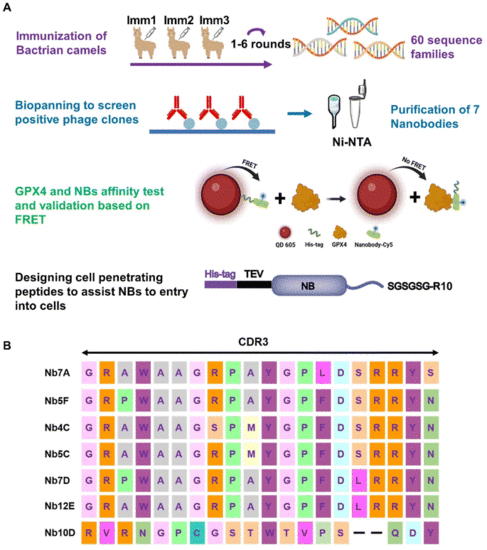
(A) Flowchart of anti-GPX4 NB screening (created with BioRender). (B) Amino acid sequences of NBs with different CDR3 domains. |
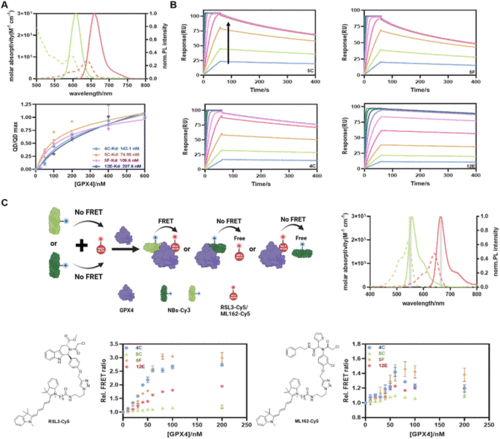
(A) QD-to-dye FRET assay to determine the GPX4 affinities of NBs. Top: absorption (dotted) and FL emission (solid) spectra of QD605 (green; 545–680 nm; resolution: 1 nm; excitation: 450 ± 5 nm; concentration: 1 μM) and Cy5-NHS (red; 610–785 nm; resolution: 1 nm; excitation: 540 ± 5 nm; concentration: 1 μM). Bottom: saturation binding curve of GPX4 and NBs from QD-to-Cy5 FRET assay. Kd values were fitted using the ‘One site-total’ model in Prism 8.0. Data are presented as the mean ± SD from three independent experiments. (B) Kinetic binding curves of GPX4 and NBs determined by SPR. The arrow indicates that the concentrations of NBs increased from 1.95 nM to 500 nM. (C) FRET measurement of the formation of the NB-GPX4-RSL3 ternary complex. Top-left: schematic representation of the FRET assay created with BioRender. Top-right: absorption (dotted) and emission (solid) spectra of Cy3-NHS (green) and Cy5-NHS (red). Optical band-pass filters (gray) were used for Cy3 (550/10 nm) and Cy5 (665/8 nm) detection in two detection channels. Bottom: FRET responses of GPX4 to different combinations of RSL3-Cy5 (left)/ML162-Cy5 (right) and four NBs. The assays included constant concentrations of NB-Cy3 and RSL3-Cy5 and varying concentrations of GPX4. FRET data are presented as the mean ± SD from three independent experiments. |
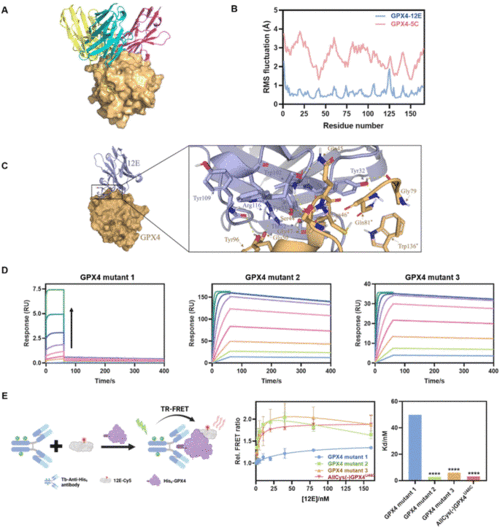
(A) Molecular modeling of GPX4 and NBs 12E (blue), 4C (purple) and 5C (yellow). (B) RMSF of GPX4 within GPX4-12E or GPX4-5C complexes. (C) Molecular surface and zoomed-in views of interactions of the GPX4-12E complex. (D) Kinetic binding curves of GPX4 mutants (mutants 1, 2 and 3) and 12E determined by SPR. The arrow indicates that the concentrations of NBs increased from 1.95 nM to 500 nM. AllCys(-)GPX4U46C,S44A, Q45A, K48A, E50A, AllCys(-)GPX4U46C, I129A, L130A, K135A, W136A and AllCys(-)GPX4U46C, P155A, M156A, E157A were named GPX4 mutants 1, 2, and 3, respectively. (E) TR-FRET measurement for the affinity tests of GPX4 mutants and 12E. Left: schematic representation of the TR-FRET measurement. Middle: affinity binding curves of GPX4 mutants and 12E via TR-FRET. The results were repeated two times and presented as mean ± SD (n = 2). Right: the Kd values of GPX4 mutants and 12E via TR-FRET. Kd was obtained by fitting the relative FRET ratio with the ‘One site-total binding’ model in Prism 8.0. ****p < 0.0001 vs. the vehicle control. |
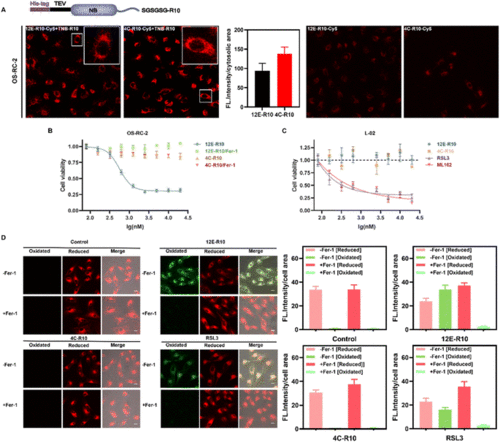
(A) Intracellular delivery efficiency of the NB-R10 fusion protein with TBN-R10 additives. Top: schematic design of NB-R10 fusion protein. Bottom: CLSM images of OS-RC-2 cells incubated with 5 μM 12E-R10-Cy5 or 4C-R10-Cy5 in the presence or absence of 10 μM TNB-R10 for 1 h at 37 °C. Excitation: 581 nm; emission: 580–650 nm; scale bar: 20 μm. Individual cytosolic fluorescence intensity of the CLSM images in the presence of TNB-R10 was processed with Image J software. (B) Viabilities of OS-RC-2 cells incubated with 12E-R10/4C-R10 and 10 μM TNB-R10 in the presence or absence of Ferrostatin-1 (−Fer-1, ferroptosis inhibitor) for 12 h at 37 °C. (C) Viabilities of L-02 cells incubated with 4C-R10/12E-R10 and 10 μM TNB-R10 additives, or small molecular inhibitors RSL3 and ML162 at 37 °C for 72 h. The results were repeated three times and presented as mean ± SD (n = 3). (D) Lipid peroxidation induced by 12E-R10, 4C-R10 and RSL3 based on C11 BODIPY581/591 cell imaging. OS-RC-2 cells were first incubated with 5 μM 12E-R10/4C-R10 (in the presence of 10 μM TNB-R10) and RSL3 (1 μM) at 37 °C for 2 h, and then incubated with 1 μM C11 BODIPY581/591 for 30 min for imaging; scale bar: 20 μm. Cells were also pre-incubated with (+Fer-1) or without Fer-1 (−Fer-1). Individual cell fluorescence intensity in different channels of the CLSM images (processed with Image J software) was indicated on the right of the images. |
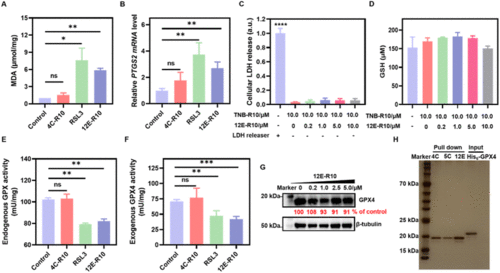
Bio-evaluations of ferroptosis related parameters. (A) MDA assay. (B) PTGS2 mRNA detection. (C) LDH release. (D) GSH concentrations. (E) Endogenous GPX activity. (F) Exogenous GPX4WT activity. (G) WB analysis of GPX4 degradation. (H) Proteome profiles of 4C-R10, 5C-R10 and 12E-R10 assessed by SDS-PAGE (silver staining). Lane 1: marker; Lanes 2–4: 4C-R10, 5C-R10 and 12E-R10 pull-down of OS-RC-2 cell lysates; Lane 5: recombinant GPX4 protein sample. OS-RC-2 cells were incubated with 5 μM 12E-R10/4C-R10 in the presence of 10 μM TNB-R10 or 0.8 μM RSL3 for 4 h (A, B, and E). (A–F) Results were repeated three times and presented as mean ± SD (n = 3). *p < 0.05, **p < 0.01, ***p < 0.001, and ****p < 0.0001 vs. the vehicle control. |
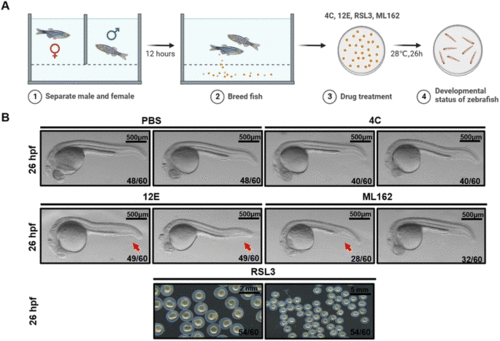
Zebrafish dorsal organizer formation impaired by NB 12E. (A) Schematic representation of the observation for early development of zebrafish. (B) Brightfield images of the wild-type (WT) embryos at the indicated stages after the injection of 7 μM RSL3/12E/4C and PBS (the injection volume is 1 nL). The red arrow indicates the reduced ventral tail fin. The frequency of embryos with the indicated patterns is shown in the bottom right corner of each panel. Lateral views with anterior to the left. Scale bar = 500 μm. |