
|
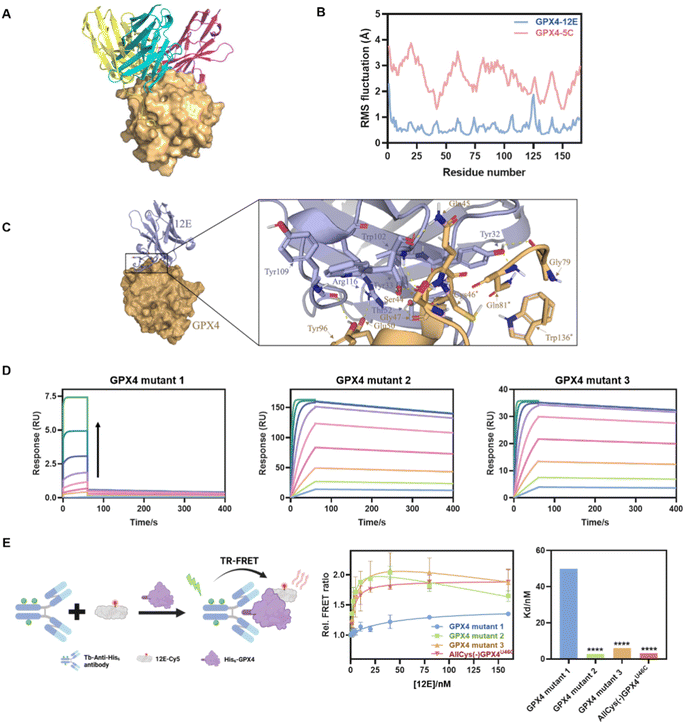
Fig. 3 (A) Molecular modeling of GPX4 and NBs 12E (blue), 4C (purple) and 5C (yellow). (B) RMSF of GPX4 within GPX4-12E or GPX4-5C complexes. (C) Molecular surface and zoomed-in views of interactions of the GPX4-12E complex. (D) Kinetic binding curves of GPX4 mutants (mutants 1, 2 and 3) and 12E determined by SPR. The arrow indicates that the concentrations of NBs increased from 1.95 nM to 500 nM. AllCys(-)GPX4U46C,S44A, Q45A, K48A, E50A, AllCys(-)GPX4U46C, I129A, L130A, K135A, W136A and AllCys(-)GPX4U46C, P155A, M156A, E157A were named GPX4 mutants 1, 2, and 3, respectively. (E) TR-FRET measurement for the affinity tests of GPX4 mutants and 12E. Left: schematic representation of the TR-FRET measurement. Middle: affinity binding curves of GPX4 mutants and 12E via TR-FRET. The results were repeated two times and presented as mean ± SD (n = 2). Right: the Kd values of GPX4 mutants and 12E via TR-FRET. Kd was obtained by fitting the relative FRET ratio with the ‘One site-total binding’ model in Prism 8.0. ****p < 0.0001 vs. the vehicle control.