
|
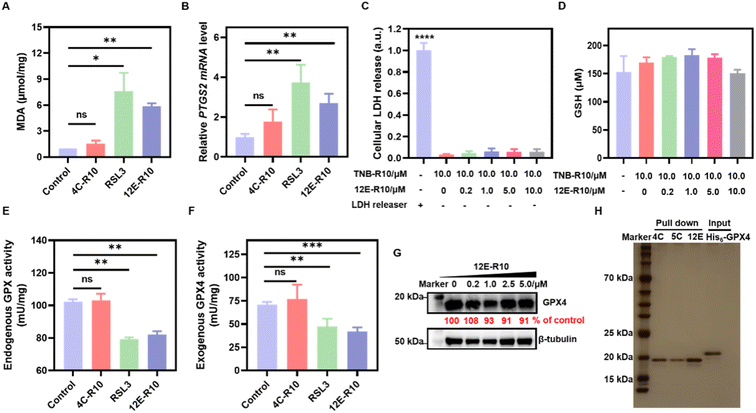
Fig. 5 Bio-evaluations of ferroptosis related parameters. (A) MDA assay. (B) PTGS2 mRNA detection. (C) LDH release. (D) GSH concentrations. (E) Endogenous GPX activity. (F) Exogenous GPX4WT activity. (G) WB analysis of GPX4 degradation. (H) Proteome profiles of 4C-R10, 5C-R10 and 12E-R10 assessed by SDS-PAGE (silver staining). Lane 1: marker; Lanes 2–4: 4C-R10, 5C-R10 and 12E-R10 pull-down of OS-RC-2 cell lysates; Lane 5: recombinant GPX4 protein sample. OS-RC-2 cells were incubated with 5 μM 12E-R10/4C-R10 in the presence of 10 μM TNB-R10 or 0.8 μM RSL3 for 4 h (A, B, and E). (A–F) Results were repeated three times and presented as mean ± SD (n = 3). *p < 0.05, **p < 0.01, ***p < 0.001, and ****p < 0.0001 vs. the vehicle control.