
Fig. 2
- ID
- ZDB-FIG-241219-62
- Publication
- Li et al., 2024 - A potent and selective anti-glutathione peroxidase 4 nanobody as a ferroptosis inducer
- Other Figures
- All Figure Page
- Back to All Figure Page
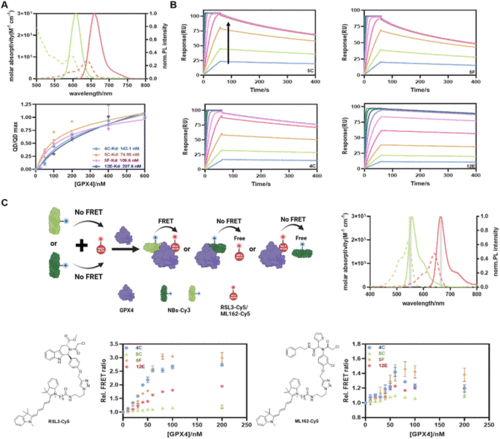
(A) QD-to-dye FRET assay to determine the GPX4 affinities of NBs. Top: absorption (dotted) and FL emission (solid) spectra of QD605 (green; 545–680 nm; resolution: 1 nm; excitation: 450 ± 5 nm; concentration: 1 μM) and Cy5-NHS (red; 610–785 nm; resolution: 1 nm; excitation: 540 ± 5 nm; concentration: 1 μM). Bottom: saturation binding curve of GPX4 and NBs from QD-to-Cy5 FRET assay. Kd values were fitted using the ‘One site-total’ model in Prism 8.0. Data are presented as the mean ± SD from three independent experiments. (B) Kinetic binding curves of GPX4 and NBs determined by SPR. The arrow indicates that the concentrations of NBs increased from 1.95 nM to 500 nM. (C) FRET measurement of the formation of the NB-GPX4-RSL3 ternary complex. Top-left: schematic representation of the FRET assay created with BioRender. Top-right: absorption (dotted) and emission (solid) spectra of Cy3-NHS (green) and Cy5-NHS (red). Optical band-pass filters (gray) were used for Cy3 (550/10 nm) and Cy5 (665/8 nm) detection in two detection channels. Bottom: FRET responses of GPX4 to different combinations of RSL3-Cy5 (left)/ML162-Cy5 (right) and four NBs. The assays included constant concentrations of NB-Cy3 and RSL3-Cy5 and varying concentrations of GPX4. FRET data are presented as the mean ± SD from three independent experiments. |