
- Title
-
Short-term polystyrene nanoplastic exposure alters zebrafish male and female germline and reproductive outcomes, unveiling pollutant-impacted molecular pathways
- Authors
- Pujol, G., Marín-Gual, L., González-Rodelas, L., Álvarez-González, L., Chauvigné, F., Cerdà, J., Teles, M., Roher, N., Ruiz-Herrera, A.
- Source
- Full text @ J. Hazard. Mater.

PS-NPs affect spermatogenesis and sperm motility. (A) Schematic representation of spermatogenesis in zebrafish. Note how the spermatogenesis cycle is organized into cysts. (B) Immunofluorescence images representing testis cysts using antibodies against RNApol II (red) and SYCP3 (green). DNA is counter stained with DAPI (blue). Scale bar 50 µm. According to staining patterns, different cell types can be distinguished: primary spermatocytes (SpcI), round spermatids (RS) and sperm. (C) Histological sections of control (upper panel) and PS-NPs exposed (lower panel) from adult zebrafish individuals stained with PAS-Hematoxylin. Scale bar 20 µm. (D) Boxplot representing the sperm median intensity (as value per pixels) ± SD for each measured cluster in both conditions (two-way ANOVA, ***p < 0.001). A total of 1292 control sperm clusters and 1259 plastic sperm clusters were included in the analysis. Eight animals were analyzed (N = 8), representing four replicates. (E) Microscopical images of spermatic water activated samples from control individuals (upper panel) and PS-NPs exposed (lower panel). Each white dot corresponds to a sperm cell whereas each green line shows its trajectory in a specific time. No-motile sperm cells are marked with a yellow sign. Scale bar 50 µm. (F) Boxplot showing the CASA calculated sperm motility percentage median ± SD for each condition (two-way ANOVA, ***p < 0.001). Six animals were analyzed, representing two replicates. |
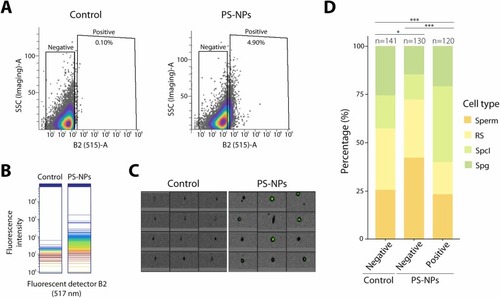
Internalization of PS-NPs in male germ cells. Cytometer profiles and enrichment analysis resulting from the sorting of testicular disaggregated samples from both control and labeled PS-NPs exposed individuals. (A) Control and PS-NPs cytometer scatter plot showing positive and negative cells for Dragon-Green fluorescent particles. Scatter plot axes represent B2 detector (B2 (515)-A), to identify positive cells for the fluorochrome, versus side scatter (SSC (Imaging)-A), which organizes cells depending on their complexity. (B) Spectral plot for B2 fluorochrome detector (517 nm) showing the density of the events by intensity for this specific detector in control and PS-NPs samples. (C) Cytometry imaging of the sorted populations, selecting the parameters LightLoss (Imaging) and Dragon-Green fluorochrome detector for both control (negative population) and PS-NPs (positive population) samples. (D) Enrichment analysis bar plot for the sorted populations representing the percentage of each spermatogenic cell type (Sperm; RS: round spermatids; SpcI: spermatocytes I; Spg: spermatogonia) in different populations (Control negative, PS-NPs negative and PS-NPs positive) (Chi-square, *p < 0.05, ***p < 0.001). A total of 120–140 cells were analyzed for each population. |
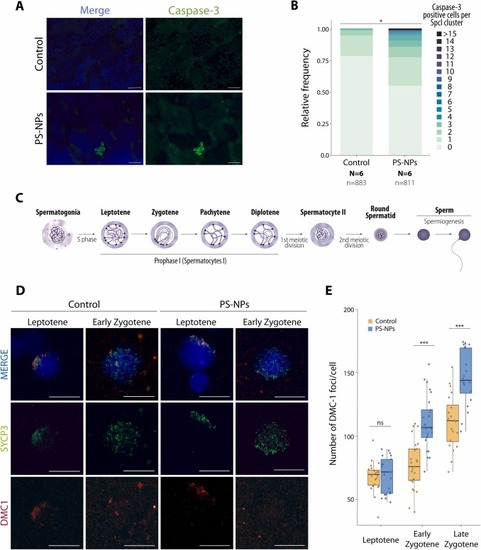
PS-NPs induce germ cell apoptosis and meiotic double strand-breaks (A) Immunofluorescence images of control (upper panel) and PS-NPs exposed (lower panel) adult zebrafish males using caspase-3 (green), DNA counter stained with DAPI (blue). Each green dot corresponds to a caspase-3 positive spermatocyte I cell. Scale bar 50 µm. (B) Bar chart representation of the relative frequency of caspase-3 positive cells per spermatocyte I testicular cyst (Chi-square, *p < 0.05). A total of 883 spermatocyte I control clusters and 811 spermatocyte I plastic exposed clusters were included in the analysis. Six animals were analyzed, representing three replicates. (C) Schematic representation of zebrafish spermatogenic process with special emphasis on meiosis and prophase I stages, where recombination takes place. (D) Representative immunofluorescence images of primary spermatocytes in different stages of meiosis from control (left panels) and PS-NPs exposed (right panels) adult zebrafish males. Images represent SYCP3 labeling of the chromosomal axes (green) and Dmc1 (red). DNA is counter stained with DAPI (blue). Scale bar 20 µm. (E) Boxplot number of DMC1 foci for each cell type and condition (two-way ANOVA, ***p < 0.001, ns nonsignificant). Boxplots are presented as median values (center line) ± SD. A total of 68 cells were analyzed for the control (n = 23 for leptotene, n = 25 for early zygotene and n = 20 for late zygotene) and 66 cells were analyzed for the exposed individuals (n = 21 for leptotene, n = 25 for early zygotene and n = 20 for late zygotene). |
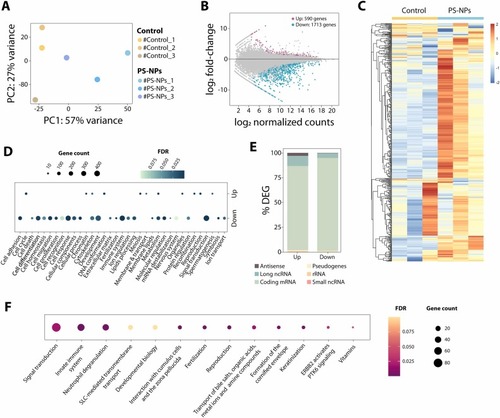
PS-NPs alter gene expression in males. (A) PCA plot including 3 individuals for each condition (control and PS-NPs exposed). (B) MAplot representation of up regulated (dark pink) and down regulated (turquoise) genes in PS-NPs exposed individuals (fold-change≥1; FDR<0.1). (C) Heat map showing the expression fold change as log2 for all 500 most differentially expressed genes between control and PS-NPs exposed adult zebrafish testicles. (D) Gene Ontology (GO) analysis of all up and down regulated genes showed in panel B. The number of genes assigned to each GO category is represented by the bubble size, whereas the color of the bubbles indicates its FDR. (E) Percentage of differentially expressed genes (DEGs) RNA biotype category, including antisense, long non-coding RNA, coding mRNA, pseudogenes, rRNA and small non-coding RNA. (F) Reactome pathway analysis of all dysregulated genes showed in panel B. The number of genes assigned to each pathway category is represented by the bubble size, whereas the color of the bubbles indicates its FDR. |
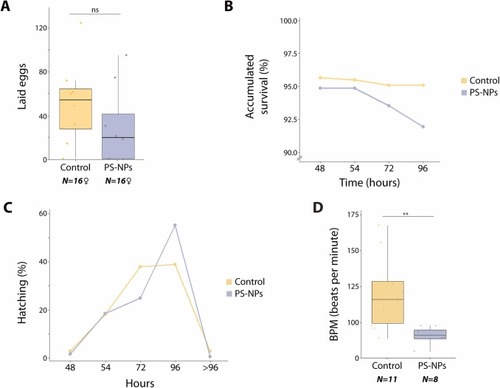
PS-NPs affect fertility and F1 individual performance. (A) Bar chart showing the average number of eggs laid for both conditions (two-way ANOVA, *p < 0.05, ns nonsignificant). Boxplots are presented as median values (center line) ± SD. Sixteen females were analyzed, representing three replicates. (B) Scatter plot showing the percentage of fecundated eggs accumulated survival from 48 hpf until 96 hpf for F0 control and F0 PS-NPs exposed descendants (two-way ANOVA, p > 0.05). (C) Scatter plot representation of the percentage of eggs hatching at different time points for control and PS-NPs exposed F0 descendants (two-way ANOVA, p > 0.05). (D) Boxplot showing F1 larvae heartbeat in bpm (beats per minute) at 7 dpf from individuals resulting from F0 control and PS-NPs exposed individuals (two-way ANOVA, **p < 0.01). Boxplots are presented as median values (center line) ± SD. Eleven control individuals and eight exposed individuals were analyzed, representing two replicates. |
Reprinted from Journal of hazardous materials, 481, Pujol, G., Marín-Gual, L., González-Rodelas, L., Álvarez-González, L., Chauvigné, F., Cerdà, J., Teles, M., Roher, N., Ruiz-Herrera, A., Short-term polystyrene nanoplastic exposure alters zebrafish male and female germline and reproductive outcomes, unveiling pollutant-impacted molecular pathways, 136529136529, Copyright (2024) with permission from Elsevier. Full text @ J. Hazard. Mater.