
|
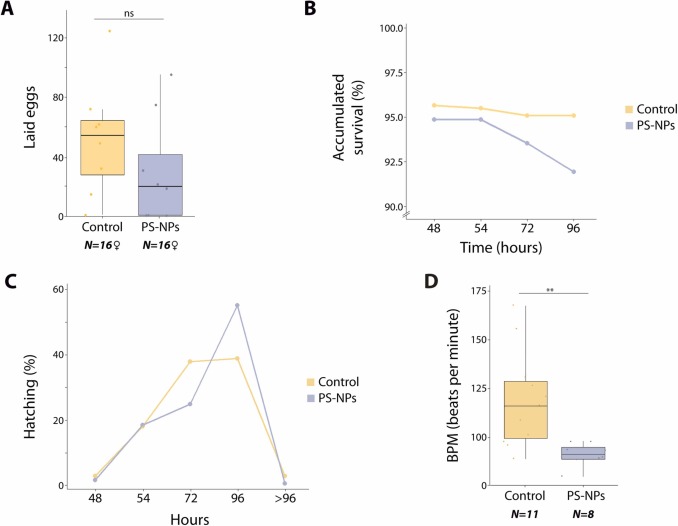
Fig. 5 PS-NPs affect fertility and F1 individual performance. (A) Bar chart showing the average number of eggs laid for both conditions (two-way ANOVA, *p < 0.05, ns nonsignificant). Boxplots are presented as median values (center line) ± SD. Sixteen females were analyzed, representing three replicates. (B) Scatter plot showing the percentage of fecundated eggs accumulated survival from 48 hpf until 96 hpf for F0 control and F0 PS-NPs exposed descendants (two-way ANOVA, p > 0.05). (C) Scatter plot representation of the percentage of eggs hatching at different time points for control and PS-NPs exposed F0 descendants (two-way ANOVA, p > 0.05). (D) Boxplot showing F1 larvae heartbeat in bpm (beats per minute) at 7 dpf from individuals resulting from F0 control and PS-NPs exposed individuals (two-way ANOVA, **p < 0.01). Boxplots are presented as median values (center line) ± SD. Eleven control individuals and eight exposed individuals were analyzed, representing two replicates.
Reprinted from Journal of hazardous materials, 481, Pujol, G., Marín-Gual, L., González-Rodelas, L., Álvarez-González, L., Chauvigné, F., Cerdà, J., Teles, M., Roher, N., Ruiz-Herrera, A., Short-term polystyrene nanoplastic exposure alters zebrafish male and female germline and reproductive outcomes, unveiling pollutant-impacted molecular pathways, 136529136529, Copyright (2024) with permission from Elsevier. Full text @ J. Hazard. Mater.