
- Title
-
dab2 is required for the scavenging function of lymphatic endothelial cells in the zebrafish meninges
- Authors
- Uphoff, K., Suárez, I., van Impel, A., Schulte-Merker, S.
- Source
- Full text @ Sci. Rep.

dab2 is expressed in BLECs. (a) Schematic representations of a 4dpf zebrafish embryo head from a lateral view. In the top drawing, a blue square marks the region shown magnified in the bottom drawing and in (b). The bottom drawing depicts BLECs (green, arrowheads) that are arranged in loops at the dorsal side of the TeO, at the midbrain-hindbrain boundary and on the ventral side of the hindbrain. Major blood vessels are illustrated in red. (b) Lateral view of an in situ hybridization against dab2 transcripts, highlighting dab2 expression within BLECs in casper-/- embryos at 80hpf (arrowheads). (c) Heat-map representing relative gene expression levels within BLECs (YuGene data published by Bower et al.10) for known lymphatic endothelial markers (lyve1b, prox1a, flt4, mafba, stabilin1, stabilin2, lyve1a, nrp2a, mmp2, mrc1a, ors2, slc7a7), the pan-endothelial marker fli1a and several genes not expressed by lymphatic endothelial cells (flt1, notch3, cdh5, kdrl, pdgfrß). Note the high dab2 expression levels in BLECs. The colour scale indicates relative expression from 1 (highest) to 0 (lowest). BLEC, brain lymphatic endothelial cell; dpf, days post fertilization; hpf, hours post fertilization; MsV, mesencephalic vein; TeO, optic tectum. EXPRESSION / LABELING:
|
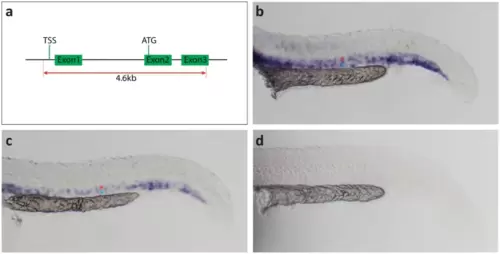
Generation of the dab2mu410 allele results in a mRNA null situation. (a) Scheme for the generation of the dab2 promoter knock-out. Two gRNAs (red dotted lines) were designed to remove the TSS and first translated ATG, resulting in a deletion of a 4.6 kb genomic fragment including the dab2 promoter. (b-c) Images of ISH stainings with a dab2 RNA antisense probe. At 24hpf, dab2 is expressed in the DA (red asterisk) and the PCV (blue asterisk) of wild type (b) and heterozygous (c) embryos, whereas no staining is detectable in homozygous mutants (d). ATG, first translated ATG; DA, dorsal aorta; hpf, hours post fertilization; ISH, in situ hybridization; PCV, posterior cardinal vein; TSS, transcription start site. |
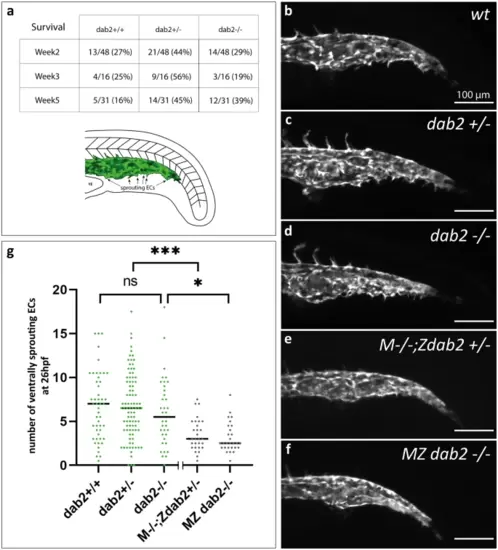
Formation of the caudal vein plexus is severely reduced in embryos that lack maternally provided dab2 mRNA. (a) Number of wild type, heterozygous and homozygous mutant fish after genotyping the progeny from a dab2+/- incross at week 2, 3 or 5 of development. At all time points, there is a high percentage of homozygous mutants. Schematic representation of the caudal vein area in the zebrafish trunk at 26hpf. In green, the caudal vein with ventrally sprouting ECs is represented. (b-f) Maximum projection of flt4:mCitrine positive zebrafish embryos at 26hpf, lateral view. Wild type embryos (b), dab2+/- (c), and dab2-/- (d) embryos develop sprouting ECs that bud off ventrally from the caudal vein. In comparison, M-/-;Zdab2+/- (e) and MZ dab2-/- (f) embryos develop fewer sprouts. (g) Quantification of the number of ventrally sprouting ECs reveals that the number is significantly lower in maternal mutant embryos (Kruskal Wallis, Mann Whitney U-test; M-/-;Zdab2+/- vs. dab2 +/-p = 0.000195 and MZ dab2-/- vs. dab2 -/-p = 0.014). The graph shows the median and all the embryos quantified (dots). hpf, hours post fertilization; MZ maternal-zygotic; YE, yolk extension. |
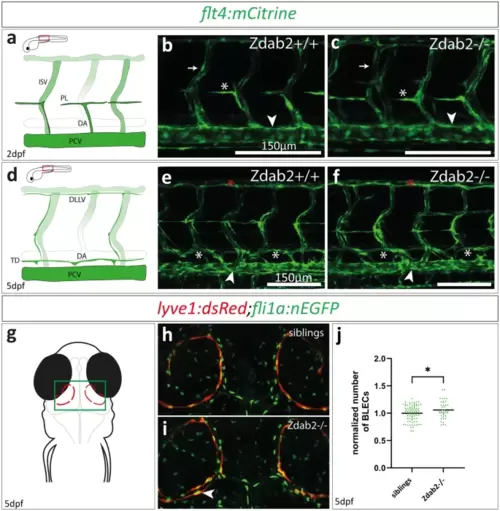
Zygotic dab2 mutants do not show lymphatic defects but exhibit elevated numbers of BLECs. (a) Schematic representation of a wild type trunk vasculature at 2dpf indicating the zoomed in area in b and c (red rectangle). (b, c) Maximum projection of confocal images of wild type (b) and homozygous dab2 mutants (c) with PL cells (white asterisk) positioned at the HM at 2dpf. The PCV (arrowhead) and ISVs (arrow) are marked as reference structures. (d) Schematic representation of the wild type trunk vasculature at 5dpf. (e, f) Maximum projection of confocal images of flt4:mCitrine-positive embryos at 5dpf. Wild type fish (e) and homozygous dab2 mutants (f) have formed the TD (white asterisks) dorsally to the PCV (arrowhead) as well as the DLLV (red asterisks). (g) Schematic drawing of a zebrafish head at 5dpf (dorsal view) with BLECs depicted in red, highlighting the area shown in (h) and (i). (h,i) Maximum projection of confocal images taken at 5dpf. Note the lyve1:dsRed signal in BLECs (red) and the fli1a:nEGFP expression marking all endothelial nuclei. While BLECs are visible in both, siblings (h) and homozygous dab2 mutants (i), dab2 mutants occasionally show a second row of BLECs (arrowheads). (j) Quantification of BLECs reveals a significant increase in BLEC numbers in dab2 mutants (Unpaired t test; siblings vs. dab2 -/- p = 0.0418). BLEC, brain lymphatic endothelial cell; DLLV, dorsal longitudinal lymphatic vessel; dpf, days post fertilization; HM, horizontal myoseptum; ISV, intersegmental vessel; PCV, posterior cardinal vein; PL, parachordal lymphangioblast; TD, thoracic duct; DA, dorsal aorta. |
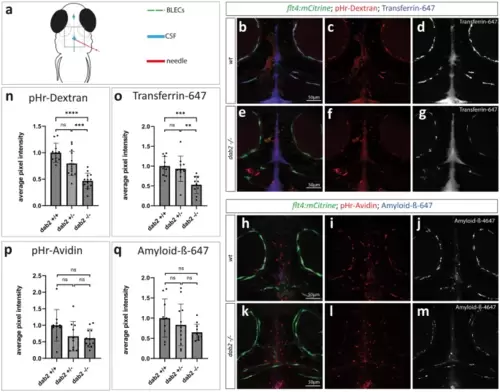
Internalization of different fluorescently labelled substances from the CSF is affected in BLECs devoid of Dab2. (a) Schematic representation of a 5dpf zebrafish embryo from a dorsal view indicating the injection site (red) into the CSF (blue). BLECs are represented in green. The dotted rectangle marks the region of imaging. (b,e and h,k) Maximum projection of a flt4:mCitrine positive wild type sibling (b-d, h-j) or dab2-/- (e-g, k-m) zebrafish embryo injected either with pHr-Dextran and Transferrin-647 (b-g) or with pHr-Avidin and Amyloid-ß-647 (h-m) at 5dpf. Images were taken 1hpi. For each substance, single channels of the respective composite pictures are shown separately. Note the higher signal intensity within BLECs in wild type (c, d, i, j) compared to dab2-/- embryos (f, g, l, m). (n-q) Quantification of pHr-Dextran (n) and Transferrin-647 (o) uptake in BLECs reveals significantly higher average pixel intensities in wild type compared to dab2-/- embryos (ANOVA, t-test; pHr-Dextran: p = 2e-7, Transferrin-647: p = 0.0008). The difference in average pixel intensities for Avidin (p) and Amyloid-ß-647 (q) between wild type and to dab2-/- embryos is not statistically significant (Kruskal Wallis, Mann Whitney U-test; pHr-Avidin: p = 0.09, Amyloid-ß-647: p = 0.296). Graphs show the mean ± SD of 2 (Amyloid-ß) to 3 (Dextran, Transferrin, Avidin) replicates and the individual data point for each embryo (dots). The average pixel intensities are normalized to wild type embryos. CSF, cerebrospinal fluid; dpf, days post fertilization; hpi, hours post injection; pHr, pH-rodo; SD, standard deviation. |