
- Title
-
Identification of a Specific Granular Marker of Zebrafish Eosinophils Enables Development of New Tools for Their Study
- Authors
- Herbert, M., Goosmann, C., Brinkmann, V., Dimmler, C., Cronan, M.R.
- Source
- Full text @ J. Immunol.
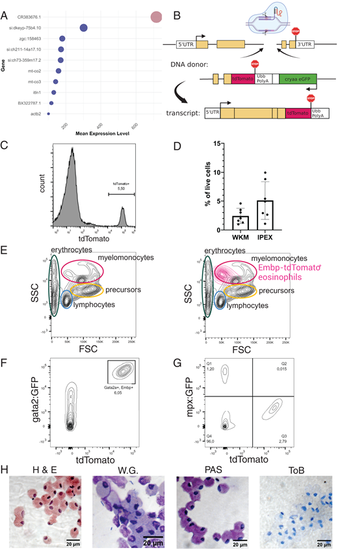
Generation of TgKI(embp-tdTomato,cryaa:EGFP) transgenic reporter line and initial validation. (A) Top 10 most highly expressed transcripts in the eosinophil population of dataset GSE161712 with color-coded information if they are protein coding. Bubble size refers to mean expression levels, and dark blue color indicates protein coding transcripts. (B) Schematic of genetic locus and DNA donor fragment inserted in the embp locus. Transcription leads to a fusion construct of Embp and tdTomato. (C) tdTomato expression in all live, single cells of a representative IPEX sample. (D) Quantification of Embp-tdTomato+ cells in whole kidney marrow (WKM) and i.p. exudate (IPEX) samples of this transgenic line, measured by flow cytometry, and presentation as a proportion of live cells: WKM 2.4 ± 0.38% and IPEX 5.1 ± 2.7% (mean with SD). n = 7. (E) Traditional gating scheme by light-scatter characteristics of a representative WKM sample as previously reported (26). Side-by-side visualization with the Embp-tdTomato+ cell population backgated onto the entire WKM in forward scatter (FSC)/side scatter (SSC). (F) Visualization of Embp-tdTomato and GFP driven by the gata2a promoter in a TgKI(embp-tdTomato,cryaa:EGFP;gata2a:GFP) double transgenic line. n = 3. (G) Visualization of Embp-tdTomato and GFP driven by the neutrophil promoter mpx in a TgKI(embp-tdTomato,cryaa:EGFP; mpx:GFP) double transgenic line. n = 3. (H) FACS-sorted Embp-tdTomato+ cells stained with H&E, Wright–Giemsa (WG), periodic acid–Schiff (PAS), and toluidine blue (ToB). n = 3. |

Confocal fluorescence microscopy of TgKI(embp-tdTomato,cryaa:EGFP) samples. (A) Imaging of a FACS isolated Embp-tdTomato+ (yellow) eosinophil. The fluorescent transgene is localized within likely eosinophil granula. Nuclear counterstain with DAPI. (B) Detection of the Embp-tdTomato transgene in 5-µm FFPE sections using an mCherry Ab. Eosinophils are found along the lamina propria lining the intestine and between organs, confirmed by H&E and PAS staining of adjacent sections. |
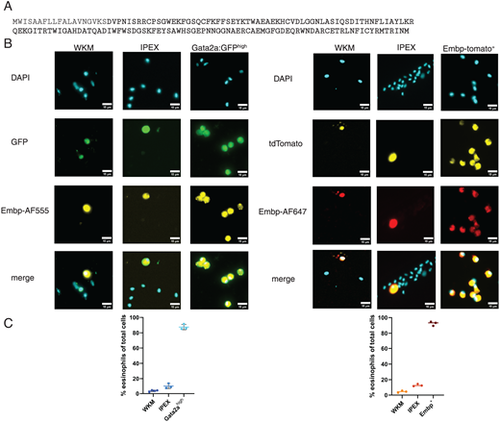
Immunofluorescence staining with a novel polyclonal Ab targeting Embp. (A) Amino acid sequence of Embp in single letter code demonstrating in bold the part of the Ag used to generate the polyclonal Ab. (B) Staining of isolated WKM, IPEX, and eosinophil cell populations of both the Tg(gata2:eGFP) and TgKI(embp-tdTomato,cryaa:EGFP) lines. Eosinophils were sorted by transgenic reporter expression (either Gata2ahigh or Embp+). n = 3. (C) Quantification of cells stained positively for Embp with polyclonal Ab in the aforementioned sorted cell populations. Positive staining was assessed in a minimum of six random fields of view across three independent experiments; 300–500 cells were evaluated per sample. Data are represented as percentage of positive Embp staining in total cell population, including mean with SD of each independent experiment. |

Embp Ab staining in FFPE tissue samples. (A) H&E, PAS, and immunofluorescence (IF) staining with Embp Ab in healthy TgKI(embp-tdTomato,cryaa:EGFP) adults. Blue indicates DAPI; yellow indicates eosinophils; magenta indicates E-cadherin staining of epithelial cells. n = 3. (B) Zoom in on a part of the WKM, showing the Embp+ stain in this tissue together with the corresponding site in H&E staining of the adjacent section. Same IF staining as in (A). (C) Staining of eosinophils in M. marinum–infected zebrafish FFPE sections. Eosinophils can be found in physiological sites in the body as well as in granuloma. Magenta indicates E-cadherin, marking epithelioid macrophages surrounding the necrotic core of the granuloma; yellow indicates eosinophils stained by Embp Ab; blue indicates DAPI. |

Cryo-immunogold EM of FACS isolated Embp-tdTomato+ eosinophils. (A) Overview of an eosinophil. (B and C) Zoom in on two different granula of this cell. Embp Ab is visualized by a 12-nm gold secondary Ab (black arrowheads) and mCherry Ab is visualized by 6-nm gold secondary Ab (white arrowheads). Both target Ags were detected in the same granule. |